Team:Peking S/project/microf
From 2011.igem.org
(→III.Results & Discussion) |
|||
| Line 90: | Line 90: | ||
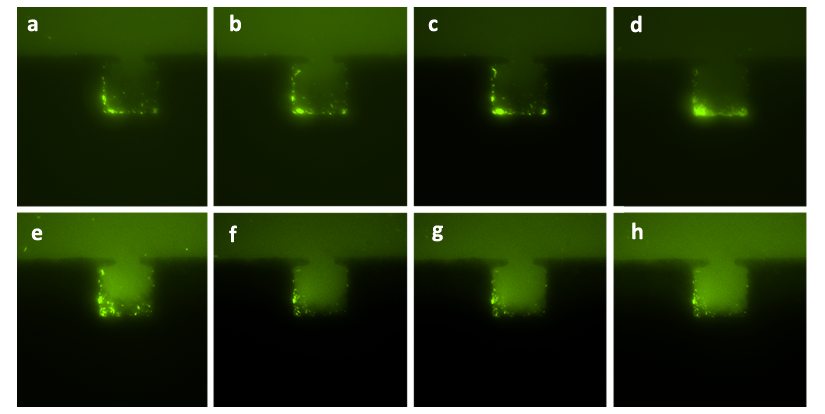
''Figure 4.The growth of the cells in one monolayer chip. Figure (a) shows the start point of growth in the chamber, when the cells were inoculated into the chamber together with the flow of nutrient solution. The photos taken at different following time points ((b), (c), (d), (e), (f), (g)) significantly show the dramatic growth of population. At the time point of 150 min (Figure (f)), the chamber was filled with cells and tended to extrude redundant cells from the chamber. At the time point of 180min (Figure (g)), the cells began to be extruded from the chamber and then drifted away. Figure (h) shows that the redundant cells are taken away by the flow of nutrient solution.'' | ''Figure 4.The growth of the cells in one monolayer chip. Figure (a) shows the start point of growth in the chamber, when the cells were inoculated into the chamber together with the flow of nutrient solution. The photos taken at different following time points ((b), (c), (d), (e), (f), (g)) significantly show the dramatic growth of population. At the time point of 150 min (Figure (f)), the chamber was filled with cells and tended to extrude redundant cells from the chamber. At the time point of 180min (Figure (g)), the cells began to be extruded from the chamber and then drifted away. Figure (h) shows that the redundant cells are taken away by the flow of nutrient solution.'' | ||
| + | |||
| + | |||
| + | <html> | ||
| + | <object type="application/x-shockwave-flash" width="400" height="400" data="http://www.flickr.com/apps/video/stewart.swf?v=71377" classid="clsid:D27CDB6E-AE6D-11cf-96B8-444553540000"> <param name="flashvars" value="intl_lang=zh-hk&photo_secret=508aa27316&photo_id=6214752279"></param> <param name="movie" value="http://www.flickr.com/apps/video/stewart.swf?v=71377"></param> <param name="bgcolor" value="#000000"></param> <param name="allowFullScreen" value="true"></param><embed type="application/x-shockwave-flash" src="http://www.flickr.com/apps/video/stewart.swf?v=71377" bgcolor="#000000" allowfullscreen="true" flashvars="intl_lang=zh-hk&photo_secret=508aa27316&photo_id=6214752279" height="400" width="400"></embed></object> | ||
| + | </html> | ||
Revision as of 20:09, 5 October 2011
Template:Https://2011.igem.org/Team:Peking S/bannerhidden Template:Https://2011.igem.org/Team:Peking S/back2
Template:Https://2011.igem.org/Team:Peking S/bannerhidden

Microfluidic Device
Contents |
A Microfluidic Chemostat for Monitoring Heterogeneous Populations of Bacteria
One of the problems that synthetic biology encounters in synthetic microbial consortia is the quantitative real time monitoring of bacterial population. Here we developed a microfluidic chemostat in which genetically heterogeneous bacterial populations are spatially insulated and controlled respectively, while in the chambers signals of ‘chemical wire’ can transmit freely from each side to the other but cells are impassable. Such a device acts as a critical component for demonstrating the function of our project and can be expanded to apply to other scientific research as well.
I.Introduction
Microfluidic devices have recently become promising tools in biochemical and chemical research for its high-throughput, extremely small scale, ready automatability, rapid analysis, real time monitoring, single cell resolution and flexible designability (King et al. 2007; Carlo et al. 2006; Fink et al.2007; Hung et al. 2005; Lee et at. 2008; Luo et al. 2007,2008,2009;). In a former study on microfluidic devices, physical constrains can be employed to control the population of the cells while providing sufficient nutrition for cells to grow in the chambers by diffusion (Luo et al. 2009). However, these devices cannot be used for synthetic microbial consortia, for the monolayer design could not offer population control on genetically heterogeneous cells respectively at the same time, and they also face the difficulty of allowing the ‘chemical wire’ molecules, for instance, AHL (acetyl-Homoserine Lactone) to diffuse freely and even from one side to the other in chambers. What’s more, it can be expected that more difficulty will hinder the application of these devices for monitoring synthetic microbial consortia because controlling of E.coli, which in much smaller cell size, rather than yeast cells.
On the other hand, research on synthetic microbial consortia faces a fatal difficulty on population control: if populations of heterogeneous cells in consortia are improper, this consortia system probably cannot work or be monitored quantitatively. For signaling receiver, the total strength of chemical wires is not only proportional to signal releasing strength of each cell, but also related closely to size of sender population. An overlarge population will result in an exceeded signal strength that saturates receiver even when each sender cell only sends very weak output, while the signal strength would be too weak to detect by receiver if the sender population is too small even when each sender cell releases signal dramatically.
Our developed chambers and channels are quite similar to those in Luo’s design, but we decreased the height of the chambers from 4μm to 2μm, to make a suitable height for E.coli to grow under physical constrain, ensuring the redundant cells to be extruded away from the chamber. Since there is no need to restrict cells to grow and divide in a monolayer colony in our project, 2μm is sufficiently low. The highlight of our work is the combination of two chiral layers with a filter membrane between. We’ll show below that this design can spatially insulate different populations of cells, control the populations in both sides respectively at the same time, and is amenable for populations in different sides to communicate via sending and receiving chemical wires. At last, we used this device to provide a demonstration on the function of A, B cells as an indispensable part in our project. Furthermore, this device can be expanded to other scientific research under the premise of subtle modification according to the aim of research.
II. Experiment
2.1 Materials and Reagents
Silicon wafers were obtained from Luoyang Mono-crystal Silicon Company; AZ 9260, AZ 50XT photo-resist and developer were purchased from USA Clariant Corporation; PDMS (Polydimethylsiloxane, RTV615) was obtained from GE Toshiba silicones Co. Ltd; other chemicals were obtained from the Department of Chemistry, Peking University. Deionized water was produced with a Milli-QSP system.
2.2 Preparation of PDMS piece and monolayer microfluidic devices
The inverted patterns in Fig. 1(a) and (b) were printed on a plastic film with a 3600 dpi printer, which was used as a mask of exposure. Fabrication of master molds was performed by patterning two layers of negative SU8 photo-resist (USA Clariant Corporation) on a silicon wafer (Luoyang Mono-crystal Silicon Company). The first layer was fabricated with 2 μm thick SU8_3002 (diluted from SU8_3025 by ourselves) using the cell chambers mask: Square cavities with different side lengths of 70 μm, 120 μm, and 150 μm. Each chamber has a capillary of 40 μm width ready to be connected to the main-channel. Layer 2 was fabricated with 40 μm thick SU8_3025. The width of the main-channel is 400 μm, such large width ensures the sufficiently slow flow velocity. PDMS (RTV615, GE Toshiba silicones Co. Ltd) devices were fabricated through a standard protocol of soft lithography on the master mold (Luo et al. 2008) with the ratio of 1:15, so that the PDMS could be sufficiently sticky for making bilayer chips.
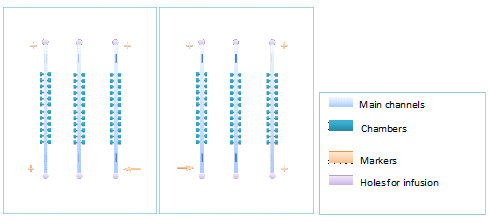
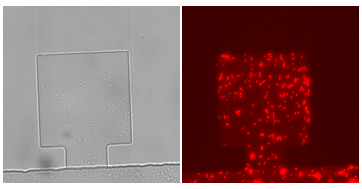
Figure1. Figure(a)illustrates a pair of chiral monolayer chips, which can be layered accurately by aligning of the corresponding markers. Make sure that the membrane doesn’t cover the markers, unless the markers cannot be seen under microscope.Figure(b)shows cells in a chamber.
For making monolayer chips, we put the PDMS piece into a drying oven with the temperature of 75℃ for several hours to dry it. After molding, the monolayer chips were cut to suitable size and punched by a metal pipe with the diameter of 0.5 mm. After oxidizing the surface in oxygen plasma for 1 min, the PDMS microfluidic channel was carefully attached to the glass.
2.3 Bilayer chips with a filter membrane between each layer
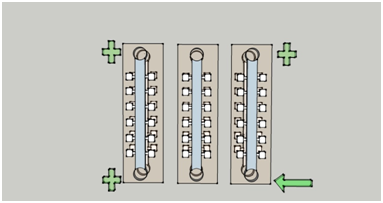
After molding of PDMS piece, different from the usual method, we placed the PDMS just at room temperature for 10 to 15 hours to make it dry as well as keeping sufficient viscosity. The time for drying was related to the weather; anyway, the chips we used for making bilayer chips must be non-deformable as well as sufficiently sticky. After molding and punching, we placed one of the chips on a piece of glass and cut a piece of membrane in a proper size and put it on the chip, and make sure that the channels and the chamber could be covered overall, while leaving the markers uncovered. The surface-membraned chip was then put under an inverted microscope (OLYMPUS CKX41). The chiral chip was then layered onto surface-membraned chip and calibrated by aligning the markers. Then the layered chips were put into the drying oven for drying and adhesion, at the temperature of 55℃, after about 5 hours, till the two layers can be attached to each other tightly.Fig.2 shows the detailed design of the bilayer chip.
(a)
(b)
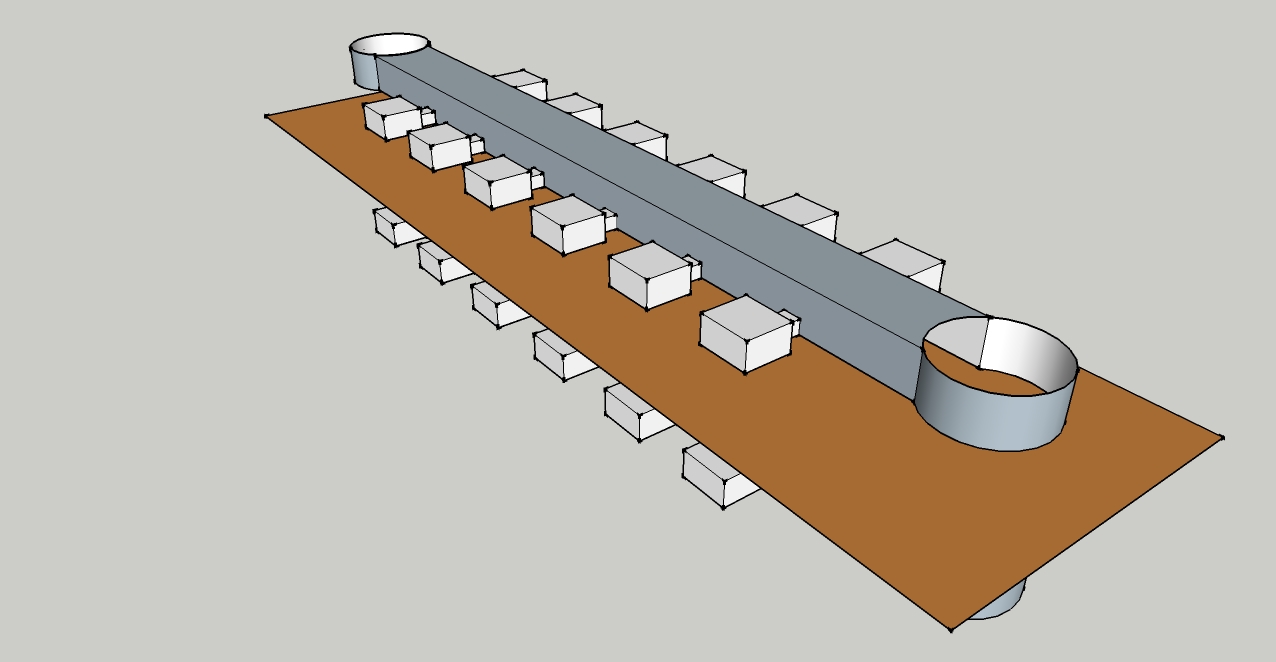
Figure2. Figure (a) illustrates the vertical view of the two-layered chip, and Figure (b) provides the side view of the bilayer chip, which consists three sections: the upper layer, the lower layer, and the filter membrane inserted between.
2.4 Operation and detection system
Fig. 3 demonstrates the experimental setup. All imaging in this work was performed using an inverted optical fluorescence microscope (Nikon) connected with a digital camera (Panasonic Super Dynamic CCD). An x-y stage controlled by win-commander was set up for automatically scanning the micro-cavity array.

Figure3. The fluorescence microscope we use for observation.
2.5 Cell culture
•Escherichia coli K-12 strain that constitutively expresses Green Fluorescent Protein (GFP) are used in monolayer experiments. •Escherichia coli K-12 strain that constitutively expresses Green Fluorescent Protein (GFP) and or Red Fluorescent Protein (RFP) are used as two kinds of genetically heterogeneous cells growing in different layers of the bilayer chip. •A cells which can respond to signaling molecules generated by CinI and B. cells which can respond to salicylate are used in the bilayer chips to test the function of each kind of cells, as a demonstration of our project. Each inducer could rouse the expression of CcdB in A and B cells respectively.
III.Results & Discussion
3.1 Results of Cultivation in Mono-layered Chip
The cultivation of the E.coli cells is shown in Fig.4. Cells growing inside the 2 μm-high cell chamber are collectively in focus and individual cells can be easily distinguished. Pictures of cell chambers are taken every 2 min, and only photos at several time points are shown below. The doubling time of the Escherichia coli cell in the micro chamber was about 50min at the temperature of 37℃, which was about the same as that in bulk solution at 37℃. The culture run over 8h and the population inside chamber was capable of maintaining over 1000 cells. The intruding velocity is 10μL/h, and the size of the chamber is 150μm×150μm.
Figure 4.The growth of the cells in one monolayer chip. Figure (a) shows the start point of growth in the chamber, when the cells were inoculated into the chamber together with the flow of nutrient solution. The photos taken at different following time points ((b), (c), (d), (e), (f), (g)) significantly show the dramatic growth of population. At the time point of 150 min (Figure (f)), the chamber was filled with cells and tended to extrude redundant cells from the chamber. At the time point of 180min (Figure (g)), the cells began to be extruded from the chamber and then drifted away. Figure (h) shows that the redundant cells are taken away by the flow of nutrient solution.
3.2 Results of Cultivation in Bilayer Chips
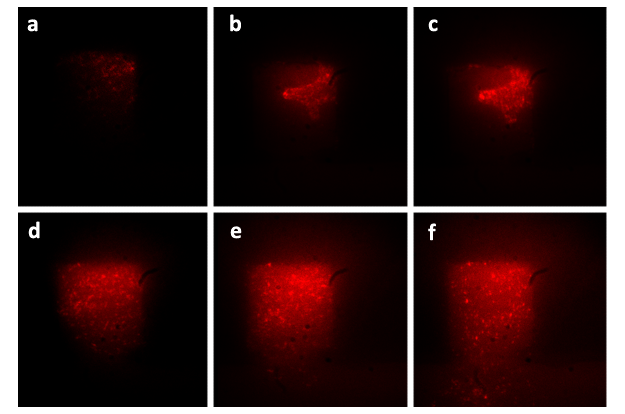
Cells constitutively expressing RFP are inoculated into upper layer, while cells constitutively expressing GFP into the lower layer. A pair of layered chambers ( which means the two chambers have the same X-Y coordinates) were selected for following observation. Fig.5 shows the two different populations growing in corresponding chambers. Comparing Figure (a) and Figure (b), it can be concluded that the two chips had been aligned accurately, considering the extremely small scale of the chambers (70μm×70μm). Figure (c) to Figure (f) are the two pairs of photos taken at the same X-Y coordinates, the same layer, and the same chamber, the same time of exposure (30ms), the same contrast ratio, but the different exciting lights (TRITC and GFP). In Figure (c), with TRITC exciting light, individual cells could be easily distinguished, while in Figure (d), with GFP as the exciting light, there is only noise observed on the CCD. Comparing Figure (c) with Figure (d) and Figure (e) to Figure (f), it can be easily concluded that the membrane inserted between two layers is impassable for cells, thus to insulate heterogeneous populations spatially.
Figure5. Cells expressing GFP or RFP grew in different layers of the bilayer chamber. Figure (a) and Figure (b) are the photos showing cells growing in the corresponding layers. Figure (c) and (d) are taken at the same X-Y coordinates, all in the lower layer, with different exciting wavelengths (TRITC and GFP), and Figure (e) and (f) were taken with the same protocol.. In Figure (a) and (b), cells expressing RFP were grown in the upper layer, while cells expressing GFP in the lower layer. In Figure (a) and (b), the size of the chambers was 70μm×70μm, while in Figure (c), (d), (e), (f), the size is 120μm×120μm, and the amplification factors are 40 in both cases.
After membrane inserted between two layers of chambers, we speculated that the growth of Ecoli could still fill the chamber. Fig. 6 proves our speculation. Pictures are taken every hour before the cells filled the chamber ((a), (b), (c), (d)), and after the chamber is filled by cells, the time interval was switched to 30min ((e), (f)). The doubling time of the Escherichia coli under this condition was about 1hour, similar to that in bulk solution at 37℃, considering the effect of lower room temperature of about 15℃ though we’d put a heater with the temperature of 37℃. The cultivation run over 15h and the population inside the chamber could be maintained around 1000. It demonstrated that the configuration of cells growth in the bilayer chips is similar to that of our developed mono-layered chip and previous microfluidic devices.
Figure6. The sequential diagrams of growth of cells in one layer of the bilayer chip (with the amplification factor of 40, the size of chambers 120μm×120μm, and the intruding velocity of 10μL/h). Figure (a) shows the initial state of the cells growing in the chamber, in which the cells were inoculated into the chamber together with the flow of nutrient solution. The photos taken at different time points ((b), (c), (d), (e), (f)) significantly show the growth of population. In Figure (d), the chamber had been filled with cells and tended to extrude redundant cells away. In Figure (e), the cells begun to be extruded away and then drift away. Figure (f) shows that as population grew, more cells were extruded away from the chamber.
3.3 Results of the A. cells and B. cells in the bilayer chips
Fig. 7 illustrates that A. cells were exterminated by the inducer generated by CinI that traversed the filter membrane. Pictures were taken every half hour. In the first three figures (Figure (a), (b) and (c)), the inducer was being inoculated in the upper layer at the flow velocity of 10μL/h, while the cells are in the lower layer with nutrient solution at the flow velocity of 10μL/h. It can be concluded that the population was nearly fixed during this time interval. After taking the third photo, we stopped the inoculation of inducer, and Figure (d) and Figure (e) shows the growth of the population contributed by the cells which were still alive during this time interval. After taking the fifth photo, the inducer was inoculated into the upper layer again at the flow velocity of 10μL/h, and Figure (f), (g), (h) show that with inducer in the upper layer, population had stopped growing again and never revived from the extermination ever since, for the fixed number of cells in the last three photos.
To be more conscientious, experiment for discreet controlled group was conducted as well. Fig.8 shows the growth of A. cells growing in the lower layer with only nutrient solution inoculated at the flow velocity of 10μL/h in the lower layer. Pictures were taken every an hour. Without inducer whether in the upper layer or in the lower layer, the cells grow persistently and much faster than that in Fig. 7. The doubling time of the cells under this condition was about 1hour, similar to that in bulk solution at 37℃, considering the effect of lower room temperature of about 15℃ though we’d put a heater with the temperature of 37℃. It demonstrated that the configuration of A. cells’ growth with only nutrient solution is far from the situation in Fig.7 with both nutrient solution and inducer which generated the expression of CcdB, the killer, but similar to that of our developed mono-layered chip and previous microfluidic devices. So far, it is proved significantly that A. cells could be killed by our chemical wire that traversed through the membrane from the upper layer to the lower layer.
Figure7. The sequential diagrams of growth of A. cells in one layer of the bilayer chip (with the amplification factor of 20, the size of chambers 120μm×120μm, and the intruding velocity of 10μL/h). Figure (a) shows the initial state of the cells growing in the chamber, in which the cells were inoculated into the chamber together with the flow of nutrient solution. There are in total three time interval in these eight photos: for Figure (a), (b) and (c), inducer generated by CinI was inoculated into the upper layer persistently, and the population nearly didn’t grow at all during this time interval; in Figure (d) and (e), inoculation of inducer was stopped for one hour, and the population grows significantly but just a little, for there were still living cells in the chamber; in Figure (f), (g), and (h), inducer had been inoculated into the upper layer again, and the population level never regained ever since.
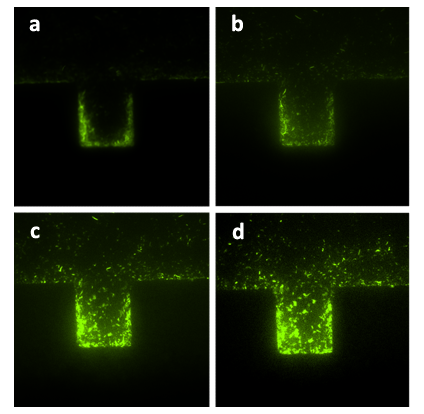
Figure8. The sequential diagrams of growth of A. cells in one layer of the bilayer chip (with the amplification factor of 20, the size of chambers 120μm×120μm, and the intruding velocity of 10μL/h). Figure (a) shows the initial state of the cells growing in the chamber, in which the cells were inoculated into the chamber together with the flow of nutrient solution and without inducer being inoculated. The photos were taken every an hour, the growth of population is significantly shown in Figure (b), (c), (d). In Figure (d), the chamber is nearly filled by A. cells. The configuration of the population growth is quite different from that in Fig. 7.
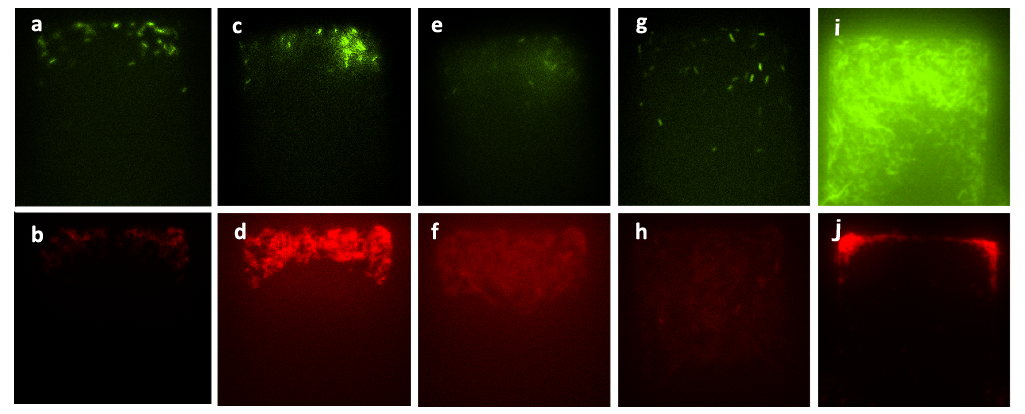
We mixed A. cells and B. cells together with nutrient solution, and inoculated the culture into the lower layer of a chip. Fig. 9 demonstrates the results of the mixed culture in our bilayer chip with different inducers inoculated in the upper layer and nutrient solution in the lower layer. In Figure (a) to (h), the inducer synthesized by CinI was inoculated into the upper layer, which was designed in our project only to induce the expression of CcdB in A. cells. While Figure (i) and (j) illustrate the result of the mixed culture grown with salicylate inoculated in the upper layer, which was designed in our project only to induce the expression of CcdB in B. cells. The different final states of the growth levels in the two conditions give us a demonstration of the orthogonality of these two chemical wires in the microbial consortia system of our project.
Figure9. Figure (a) to Figure (h) show the growth of the mixed culture with inducer generated by CinI (with the initial concentration) inoculated in the upper layer (with the amplification factor of 20, the size of chambers 120μm×120μm, and the intruding velocity of 10μL/h). Photos were taken every one hour, and the time interval lasted three hours. A. cells, which were indicated by GFP they expressed, did not grow during this time interval, while B. cells grew vigorously till they filled up the chamber. Figure (a) to Figure (h) illustrate the fact that the inducer generated by CinI could only repress the growth of A. cells. Figure (i) and Figure (j) demonstrate the final state of this mixed culture’s growth with salicylate (with the concentration of 10^(-3) mol/L )inoculated in the upper layer, which acted as the inducer designed for inducing the expression of CcdB in B ( also with the amplification factor of 20, the size of chambers 120μm×120μm, and the intruding velocity of 10μL/h). cells. In this case, A. cells finally filled up the chamber, while B. cells kept small population number after three hours’ cultivation.
To further test the function of our chemical wires and the receiving system of A, B cells, we conducted the concentration of the mixture of two inducers and monitor the growth of the mixed culture of A, B cells through fluorescence microscope (with the amplification factor of 20, the size of chambers 120μm×120μm, and the intruding velocity of 10μL/h). Fig. 10 demonstrates the results of population control under different concentration proportion of inducers. Figure (a_1) to (d_2) show that the mixed culture came to a steady state with the fixed ratio of population numbers, under the control of the mixture of salicylate with the concentration of 10^(-3) mol/L and the solution which was diluted in fold of 10^5 from the initial solution of inducer generated by CinI. Figure (e_1) to (h_2) show the deviation from the former steady state and B. cells finally won over A. cells and filled up the chamber, with few A. cells left.
Figure10. Figure (a_1) and (a_2) show the initial state of the mixed culture in the chamber, the number of A. cells and that of B. cells were almost the same. Then we inoculated the mixture of salicylate with the concentration of 〖10〗^(-3) mol/L and the solution which was diluted in fold of 10^5 from the initial solution of inducer generated by CinI, the inducers for A. cells and B. cells. Figure (b_1), (b_2), (c_1), (c_2), (d_1) and (d_2) show that the ratio of population number of A. cells to that of B. cells had changed from the initial state and stayed the same during the two hours, which means that the culture came to a steady state under the control of inducers. Figure (e_1), (e_2), (f_1), (f_2), (g_1), (g_2), (h_1) and (h_2) illustrate the growth of the mixed culture with the mixture of salicylate with the concentration of 10^(-4) mol/L and the solution which was diluted with nutrient solution in fold of 10^4 from the initial solution of inducer generated by CinI. During this time interval, B. cells grew fast while A. cells were extruded from chamber. In Figure (g_1) and (g_2), the number of B. cells decreased a little, mainly because the time-delayed effect of the control of salicylate, but the population soon recovered from the effect. Finally, in Figure (h_1) and (h_2), B. cells nearly filled up the whole chamber while there were few A. cells in the same chamber.
Conclusions
We’ve developed a bilayer microfluidic chemostat for synthetic microbial consortia with a filter membrane inserted between two chiral chips, which can insulate heterogeneous populations and control them respectively, while allowing the ‘chemical wire’ molecules to diffuse freely from each side to the other in the chamber. Such device provides suitable space for our project, and the investigation of A. cells and B. cells in this bilayer chip gives a demonstration of the signal transduction function and the orthogonality of two chemical wires and the signal inception function of both the A, B cells we constructed.
References
D.D. Carlo, N. Aghdam, L.P. Lee, Anal. Chem. 78, 4925–4930 (2006)
K.R. King, S.H. Wang, D. Irimia, A. Jayaraman, M. Toner, M.L. Yarmush, Lab. Chip. 7, 77–85 (2007).
J. Fink, M. Thery, A. Azioune, R. Dupont, F. Chatelain, M. Bornens, M. Piel, Lab. Chip. 7, 672–680 (2007).
C.X. Luo, H. Li, C.Y. Xiong, X.L. Peng, Q.L. Kou, Y. Chen, H. Ji, Q. Ouyang, Biomed. Microdevices. 9, 573–578 (2007).
C.X. Luo, X.J. Zhu, T. Yu, X.J. Luo, Q. Ouyang, H. Ji, Y. Chen, Biotechnol. Bioeng. 101, 190–195 (2008).
P.J. Hung, P.J. Lee, P. Sabounchi, R. Lin, L.P. Lee, Biotechnol. Bioeng. 89, 1–8 (2005).
P.J. Lee, N.C. Helman, W.A. Lim, P.J. Hung, Biotechniques. 44(1), 91–95 (2008).
S. Cookson, N. Ostroff, W.L. Pang, D. Volfson, J. Hasty. Mol. Syst.Biol. 1, 00024 (2005).
S.D. Talia, J.M. Skotheim, J.M. Bean, E.D. Siggia, F.R. Cross, Nature.448, 947–951 (2007).
Chunxiong Luo, Lingli Jiang, Shibo Liang, Qi Ouyang, Hang Ji, Yong Chen, Biomed Microdevices (2009).
 "
"
