Team:Wageningen UR/Project/ModellingProj1
From 2011.igem.org
(Difference between revisions)
| Line 1: | Line 1: | ||
| - | + | <!-- *** The following section shouldn't be edited if you are not completely sure about what you are doing. *** --> | |
| + | |||
| + | {{:Team:Wageningen_UR/Templates/HeaderFooterStyle}} | ||
| + | {{:Team:Wageningen_UR/Templates/NavigationLeft2}} | ||
| + | |||
| + | <!-- *** End of the "please do not edit" section. For the rest: Go ahead! :) *** --> | ||
| + | |||
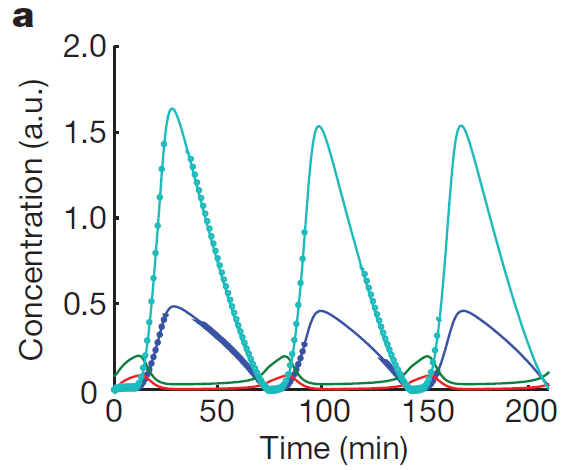
| + | Our first approach towards the modeling of our synchronized oscillatory system was to reprocude the model used by Danino et al. in the article "A synchronized quorum of genetic clocks", published in Nature in January 2010. This model will be further adapted to fit the specific devices and ressources available for the Wageningen UR iGem Team 2011. Figure 1 shows theoretical oscillation obtained by the authors of the paper and depicts "A typical time series of concentrations of LuxI (cyan circles), AiiA (blue circles), internal AHL (green line) and external AHL (red line)." | ||
| + | |||
| + | |||
| + | [[File:Template.png|230px| A typical time series of concentrations of LuxI (cyan circles), AiiA (blue circles), internal AHL | ||
| + | (green line) and external AHL (red line). LuxI and AiiA closely track each other, and are anti-phase with the concentrations of external and internal AHL. Graph and explanation taken from the article "A synchronized quorum of genetic clocks" [Tal Danino, Octavio Mondragón-Palomino, Lev Tsimring2 & Jeff Hasty, Nature, January 2010]] | ||
Revision as of 13:20, 10 May 2011
Our first approach towards the modeling of our synchronized oscillatory system was to reprocude the model used by Danino et al. in the article "A synchronized quorum of genetic clocks", published in Nature in January 2010. This model will be further adapted to fit the specific devices and ressources available for the Wageningen UR iGem Team 2011. Figure 1 shows theoretical oscillation obtained by the authors of the paper and depicts "A typical time series of concentrations of LuxI (cyan circles), AiiA (blue circles), internal AHL (green line) and external AHL (red line)."
 "
"
