 "
"
Team:WHU-China/Project/Modeling
From 2011.igem.org
| Line 254: | Line 254: | ||
<div style="position:relative"> | <div style="position:relative"> | ||
<p>As the changes of cycle time with the change of the parameters in the image , we can get the conclusion that:</br> | <p>As the changes of cycle time with the change of the parameters in the image , we can get the conclusion that:</br> | ||
| - | 1.<img src="/wiki/images/ | + | 1.<img src="/wiki/images/6/63/Whu-Image029.png"/>have little influence on the range.</br> |
2.<img src="/wiki/images/8/82/Image030.png"/>do not have much influence on the cycle time.</br> | 2.<img src="/wiki/images/8/82/Image030.png"/>do not have much influence on the cycle time.</br> | ||
3.<img src="/wiki/images/1/11/Image031.png"/>have inversely proportional relationship with the cycle time , it have a huge influence on the cycle time , but little impact on the range (Can be used to adjust the cycle to maintain constant amplitude)</br> | 3.<img src="/wiki/images/1/11/Image031.png"/>have inversely proportional relationship with the cycle time , it have a huge influence on the cycle time , but little impact on the range (Can be used to adjust the cycle to maintain constant amplitude)</br> | ||
Revision as of 08:40, 4 October 2011
Where means the volume of
 ,
, means the volume of
 ,
, means the delay time of the reaction.
This is the classic delay ODE , using the matlab software, we got the solution image ;
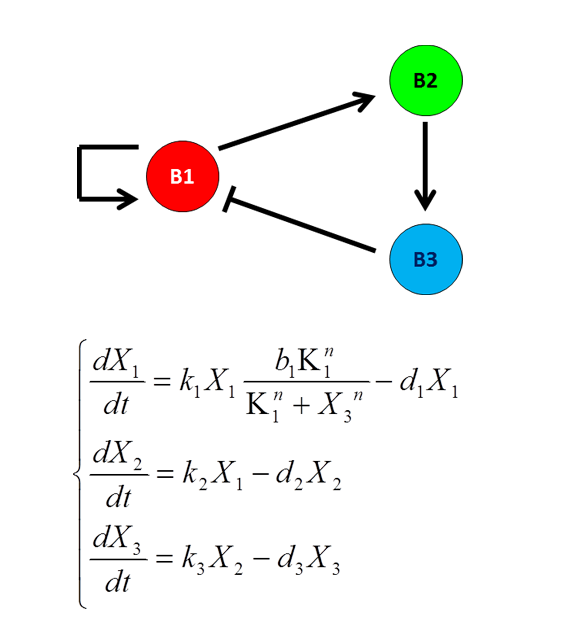
We mainly consider the system including three protein: We also use delay ODE to describe the system:
where: means the volume of
  though dimensionless:
The balance point of the equation is and
and 


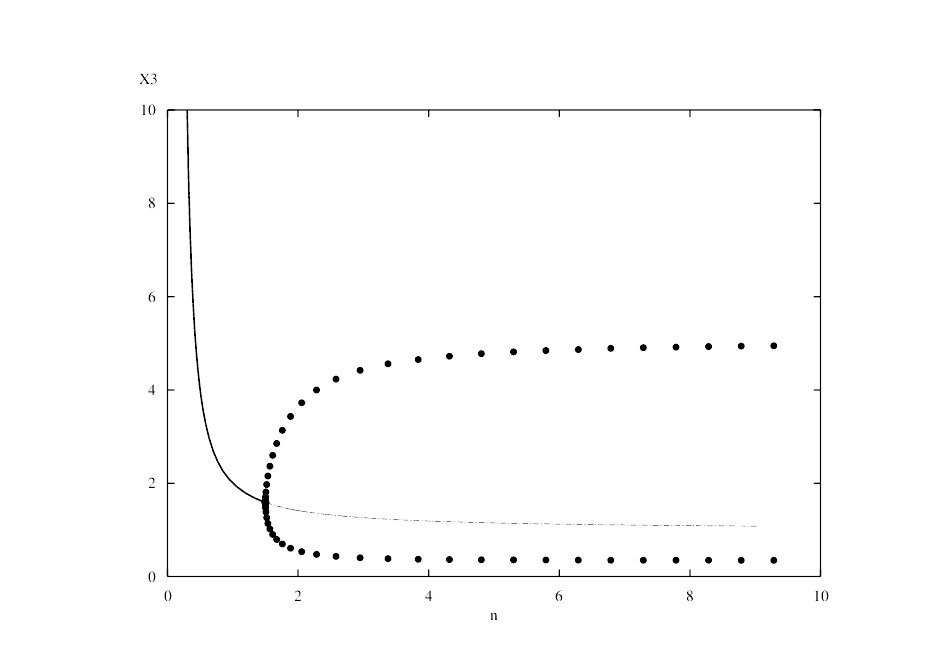
Using the MATLAB software to plot we got the solution image:

 is the Hopf bifurcation point, when
 ,it is able to generate a stable periodic solution.
 is the Hopf bifurcation point, when
 ,it is able to generate a stable periodic solution.
 is the Hopf bifurcation point, when
 ,it is able to generate a stable periodic solution.
 is the Hopf bifurcation point, when
 ,it is able to generate a stable periodic solution.


Cycle with the curve of each parameter:

As the changes of cycle time with the change of the parameters in the image , we can get the conclusion that:
1. have little influence on the range.
2.
have little influence on the range.
2. do not have much influence on the cycle time.
3.
do not have much influence on the cycle time.
3. have inversely proportional relationship with the cycle time , it have a huge influence on the cycle time , but little impact on the range (Can be used to adjust the cycle to maintain constant amplitude)
4.When
have inversely proportional relationship with the cycle time , it have a huge influence on the cycle time , but little impact on the range (Can be used to adjust the cycle to maintain constant amplitude)
4.When ,
, have little influence on the range.
This conclusion we get before can be used to guide the design of biological systems, in order to achieve the adjustment period, amplitude can adjust the size of some parameters.
have little influence on the range.
This conclusion we get before can be used to guide the design of biological systems, in order to achieve the adjustment period, amplitude can adjust the size of some parameters.


days
hours
minutes
seconds
Visitor
