Team:Potsdam Bioware/Project/Details Modeling
From 2011.igem.org
Modeling
Motivation
There is no synthetic biology without modeling, of course. In principle there is structure modeling and system modeling. In structure-modeling the conformation and structure of proteins is examined and steric consequences for reactions or the whole system can be estimated. We focused on the second sort of modeling: The systems modeling in which the reaction kinetics of the whole system is analyzed and outcomes are predicted. Thus, a synthetic biology approach can be chosen because a better understanding of the system is achieved and further changes can be planed - just like in engineering.
Model
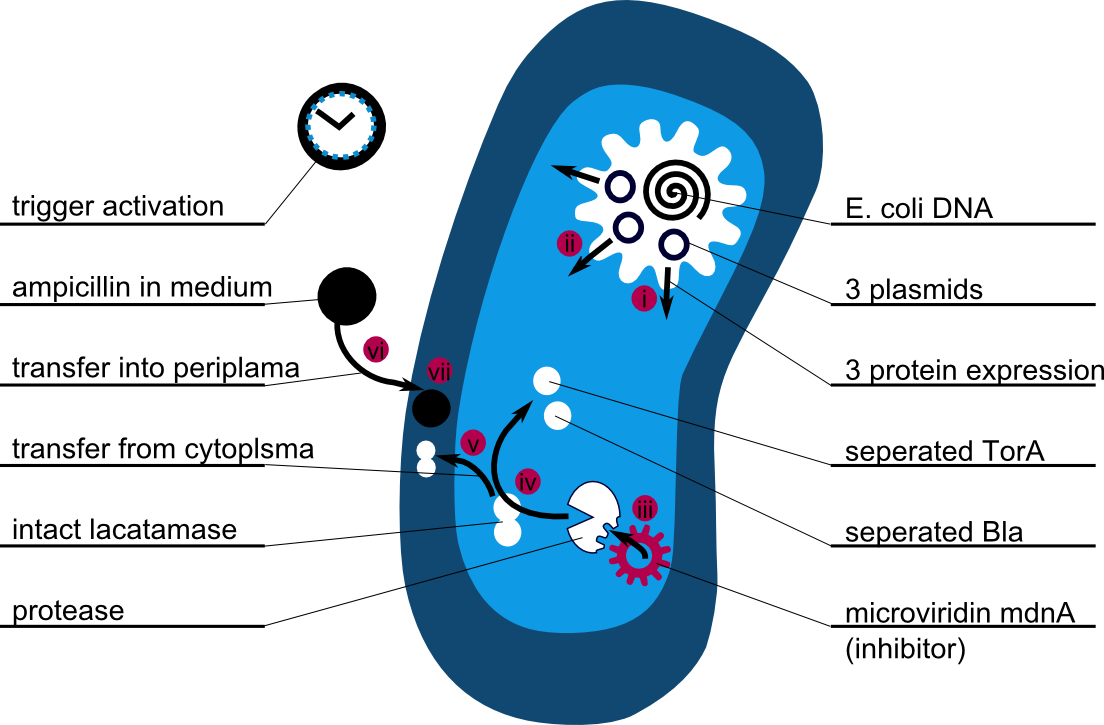
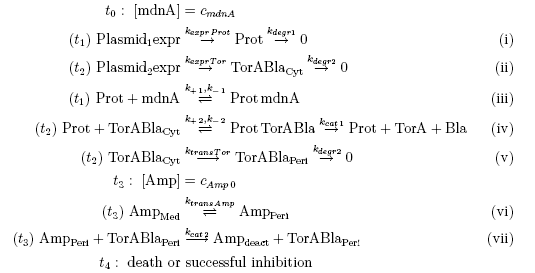
The following schema shows the major reactions taking place in our cell system. The Romanic numbers indicate the place of reactions that were written down as equations and then numerically propagated through time. We were able to see that our system works very well in theory. We learned about correct time-scales for our triggering and we were able to identify expected cell-division rates as reference for lab work.
The schema shows the triggered expression of mircoviridin (our inhibitor), the protease (that needs to be inhibited for medical reasons) and the β-lactamase. The protease cleaves at a specific recognition site in the linker peptide. This will abolish the β-lactamase export and in consequnece the cell will die.
There are three important trigger activation times:
(t0) - start (microviridin added already)
t1 - start expression of protease
t2 - start expression of β-lactamase
t3 - Ampicillin added into medium
(t4) - end of the experiment: cell cultures survive or die.
Keeping these times in mind, the reactions can be written down in seven chemical reaction equations of different sort and order.
Concentration equations
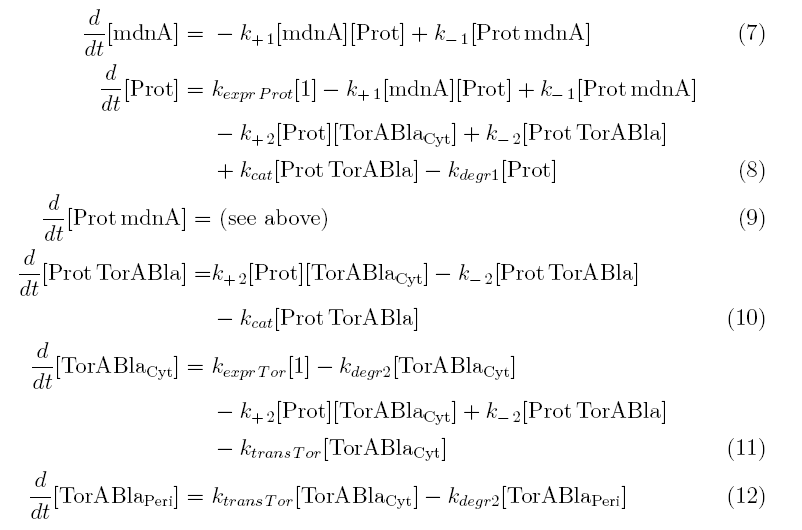
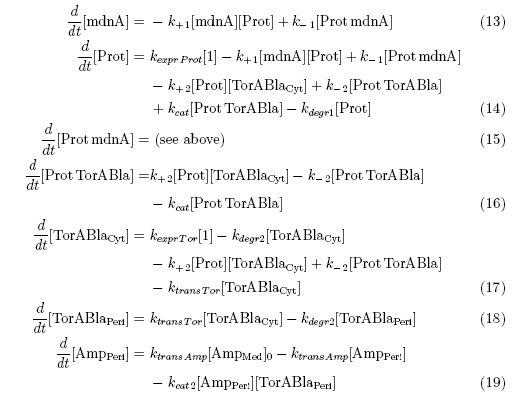
From the above reaction equations differential equations can be derived that describe the change of substance concentrations. Three concentrations are fixed, however:
All other concentrations can be represented in form of differential equations. Between time t1 and t2 four factors are introduced:
k+1 in (1/s*#molecules)- factor for association of MdnA (microviridin) and Prot (protease)
k-1 in (1/s) - factor for dissociation of the inhibited protease
kexpr.prot in (#molecules/s) - factor for the expression of protease
kdeg1 in (1/s) -factor for degradation of protease
Between time t2 and t3 six additional factors are introduced:
k+2 in (1/s*#molecules)- factor for association of Prot (protease) and TorABla (β-lactamase)
k-2 in (1/s) - factor for dissociation of protease and substrate
kcat in (1/s) – factor for the catalytic enzyme reaction that cleaves the single TorA sequence from the β-lactamase inactivating the export
kexpr.Tor in (#molecules/s) - factor for the expression of β-lactamase
kdeg2 in (1/s) – factor for degradation of β-lactamase
ktransTor (1/s) – factor by which β-lactamase in the cytoplasm is able to pass the membrane and get into the periplasm
After t3 there are only two more factors that we should introduce:
ktransAmp (1/s) – factor by which the added Ampicillin in the medium is able to pass the outer membrane and get into the periplasm
kcat2 in (1/s*#molecules) – factor for the catalytic enzyme reaction that cleaves the single TorA sequence from the β-lactamase
Results
The equations above were solved using MATLAB. Using the Avogadro constant and the volume of a E.coli cell (10^-15L) and a periplasm-volume of about 5%, following constants were calculated and compared with similar literature values:
k+1 = 1.e-6 (1/molecules*s)
k-1 = 2.e-4 (1/s)
kexpr.Prot = 1 (molecules/s)
kdegr1 = 3.e-3 (1/s)
k+2 = 5.e-7 (1/molecules*s)
k-2 = 4.e-4 (1/s)
kcat = 8 (1/s)
kexpr.Tor = 1.4 (1/s)
kdegr2 = 3.e-3 (1/s)
ktransTor = 3.e-3 (1/s)
ktransAmp = 3.e-3 (1/s)
Kcat2 = 0.3 (1/molecules*s)
MIC(0) = 8000 (molecules)
AMP(0) = 5000 (molecules)
It can be seen that there is only a negligible amount of Ampicillin in the periplasm if the expression works as indicated. There is also a wide tolerance left for suboptimal conditions. The trigger time t1, t2 and t3 shall be about one hour after one another.
In the first section the effect of the inhibition can clearly be seen: Even though the continuous expression of protease, only a very small number remains active in the cytoplasm. In the second section β-lactamase is expressed. Most of the β-lactamase in the cytoplasm is destroyed by the protease, however the number is by far large enough to steadily release molecules into the periplasm where it cannot be affected by the protease any more. Because the volume of the periplasm is very small, the concentration there is even higher than the absolute amount of molecules in the graph suggests compared to the amount of molecules in the cytoplasm. The third section shows that the concentrations remain very steady and the cells are Ampicillin resistant.
Cells passing this procedure are very Ampicillin resistant and grow fast: They double their cell volume about every 20 minutes. If an error would appear and the Ampicillin concentration inside the periplasma would increase over 2µg/ml, the growth rate would slow down drastically and the cells might die. This way defect cell cultures can easily be separated from the good ones.
The ratio of Ampicillin concentration in n µg/ml to the growth rate (cells double during this timespan) is approximately this: T(growth) = 20min+10*2^(n-1).
MATLAB code
Media:conzt1.m
Media:conzt2.m
Media:conzt3.m
Media:plottfuntionendreiaufeinmal2.m
 "
"


