Team:Potsdam Bioware/Project/Details
From 2011.igem.org
TobyWenzel (Talk | contribs) (→Modelling) |
(→Phage Display) |
||
| Line 15: | Line 15: | ||
<br> | <br> | ||
The phage display vector pPDV089 was derived from the plasmid pARW089 which carries the whole ''mdn''-cluster. This plasmid contains a plasmid origin of replication and additionally a f1 ori which enables the packaging of single strand DNA into phages. For selective amplification ampcillin and kanamycin resistance genes are included. To create the phagemid pPDV089 standard cloning procedure were performed. | The phage display vector pPDV089 was derived from the plasmid pARW089 which carries the whole ''mdn''-cluster. This plasmid contains a plasmid origin of replication and additionally a f1 ori which enables the packaging of single strand DNA into phages. For selective amplification ampcillin and kanamycin resistance genes are included. To create the phagemid pPDV089 standard cloning procedure were performed. | ||
| - | First ''mdnA'' was deleted by excising using the restriction enzymes SfoI and AatII. The next step comprised the introduction of a ''mdnA- | + | First ''mdnA'' was deleted by excising using the restriction enzymes SfoI and AatII. The next step comprised the introduction of a ''mdnA-gene III''-fusion gene. Therefore gene III was amplified from pak100blaKDIR and ''mdnA'' from pARW089 by PCR. The primers were designed to enable the introduction of iGEM and other restriction sites required for further cloning steps. The purified PCR product ''gene III'' was digested by NgoMIV and AatII whereas the PCR product ''mdnA'' was digested by SfoI and AgeI. Subsequent the three fragment ligation of ''mdnA'' and ''gene III'' into the digested vector has been conducted. Thus a ''mdnA-gene III''-fusion part according to RFC25 was generated whereby AgeI and NgoMIV overhangs are compatible and placed in frame with the protein sequence. The ligation of AgeI and NgoMIV overhangs resulted in a scar coding for the threonine and glycine. Because the introduction of restriction sites before ''mdnA'' leaded to a great distance between ribosome binding site and ''mdnA'' a second RBS was inserted among SfoI and XbaI recognition sites to ensure a sufficiently expression rate of the mdnA-gene III-fusion gene. The myc sequence located between ''mdnA'' and ''gene III'' allows the detection of the expression of the ''mdnA-gene III''-fusion protein on the surface of the phage using western blot or ELISA. In the last step the kanamycin resistance gene was disturbed because for phage display the selection of cells carriyng both helper phages and the phagemid is beneficial and the helper phages have a kanamycin resistance too. Therefore a 300 bp fragment of the kanamycin resistance gene was deleted using the restriction enzyme NsiI which had two recognition sites in the kanamycin gene. |
Revision as of 22:53, 20 September 2011
Details
Lorem ipsum dolor sit amet, consetetur sadipscing elitr, sed diam nonumy eirmod tempor invidunt ut labore et dolore magna aliquyam erat, sed diam voluptua. At vero eos et accusam et justo duo dolores et ea rebum. Stet clita kasd gubergren, no sea takimata sanctus est Lorem ipsum dolor sit amet. Lorem ipsum dolor sit amet, consetetur sadipscing elitr, sed diam nonumy eirmod tempor invidunt ut labore et dolore magna aliquyam erat, sed diam voluptua. At vero eos et accusam et justo duo dolores et ea rebum. Stet clita kasd gubergren, no sea takimata sanctus est Lorem ipsum dolor sit amet.
Microviridin
Lorem ipsum dolor sit amet, consetetur sadipscing elitr, sed diam nonumy eirmod tempor invidunt ut labore et dolore magna aliquyam erat, sed diam voluptua. At vero eos et accusam et justo duo dolores et ea rebum. Stet clita kasd gubergren, no sea takimata sanctus est Lorem ipsum dolor sit amet. Lorem ipsum dolor sit amet, consetetur sadipscing elitr, sed diam nonumy eirmod tempor invidunt ut labore et dolore magna aliquyam erat, sed diam voluptua. At vero eos et accusam et justo duo dolores et ea rebum. Stet clita kasd gubergren, no sea takimata sanctus est Lorem ipsum dolor sit amet.
Phage Display
Cloning
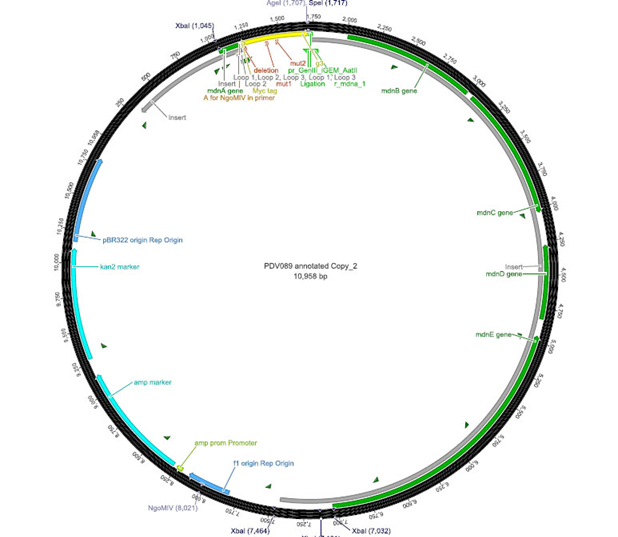
The phage display vector pPDV089 was derived from the plasmid pARW089 which carries the whole mdn-cluster. This plasmid contains a plasmid origin of replication and additionally a f1 ori which enables the packaging of single strand DNA into phages. For selective amplification ampcillin and kanamycin resistance genes are included. To create the phagemid pPDV089 standard cloning procedure were performed.
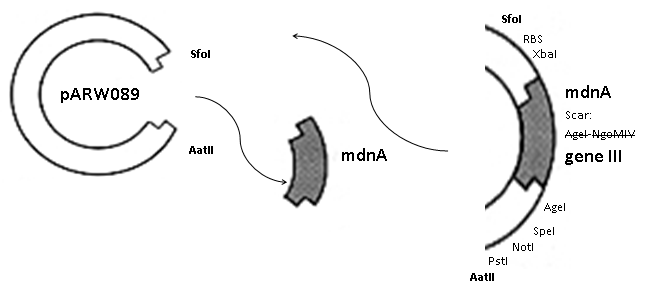
First mdnA was deleted by excising using the restriction enzymes SfoI and AatII. The next step comprised the introduction of a mdnA-gene III-fusion gene. Therefore gene III was amplified from pak100blaKDIR and mdnA from pARW089 by PCR. The primers were designed to enable the introduction of iGEM and other restriction sites required for further cloning steps. The purified PCR product gene III was digested by NgoMIV and AatII whereas the PCR product mdnA was digested by SfoI and AgeI. Subsequent the three fragment ligation of mdnA and gene III into the digested vector has been conducted. Thus a mdnA-gene III-fusion part according to RFC25 was generated whereby AgeI and NgoMIV overhangs are compatible and placed in frame with the protein sequence. The ligation of AgeI and NgoMIV overhangs resulted in a scar coding for the threonine and glycine. Because the introduction of restriction sites before mdnA leaded to a great distance between ribosome binding site and mdnA a second RBS was inserted among SfoI and XbaI recognition sites to ensure a sufficiently expression rate of the mdnA-gene III-fusion gene. The myc sequence located between mdnA and gene III allows the detection of the expression of the mdnA-gene III-fusion protein on the surface of the phage using western blot or ELISA. In the last step the kanamycin resistance gene was disturbed because for phage display the selection of cells carriyng both helper phages and the phagemid is beneficial and the helper phages have a kanamycin resistance too. Therefore a 300 bp fragment of the kanamycin resistance gene was deleted using the restriction enzyme NsiI which had two recognition sites in the kanamycin gene.
 | 
|
| cloning strategy of the BioBrick | phagemid pPDV089 | |
ELISA
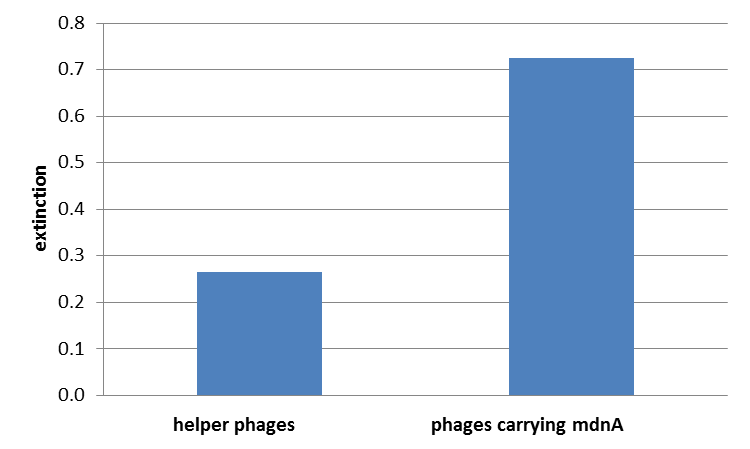
The next step was the detection of the expression of the mdnA-myc-geneIII-fusion gene on the surface of the phage. So E. coli cells XL1-Blue were first transformed with the phagemid pPDV089 before they were infected with helper phages. E. coli cells containing both plasmids were selected. An ELISA test was performed to determine whether these cells are able to produce phage particles carrying the mdnA peptide on their surface. To perform this test anti-myc-antibodies were immobilized on ELISA plates and incubated with purified phages. For detection a second antibody coupled with horse radish peroxidase (HRP) was used which binds the gene VIII protein of the phages. The HRP substrate 3,3'-5,5'-Tetramethylbenzidine (TMB) was added and in case of binding a colour reaction was expected. The colour shift from achromatic to yellow showed the successful expression of mdnA-gene III-fusion protein on the phages.
In Vivo Selection
Lorem ipsum dolor sit amet, consetetur sadipscing elitr, sed diam nonumy eirmod tempor invidunt ut labore et dolore magna aliquyam erat, sed diam voluptua. At vero eos et accusam et justo duo dolores et ea rebum. Stet clita kasd gubergren, no sea takimata sanctus est Lorem ipsum dolor sit amet. Lorem ipsum dolor sit amet, consetetur sadipscing elitr, sed diam nonumy eirmod tempor invidunt ut labore et dolore magna aliquyam erat, sed diam voluptua. At vero eos et accusam et justo duo dolores et ea rebum. Stet clita kasd gubergren, no sea takimata sanctus est Lorem ipsum dolor sit amet.
Modelling
There is no synthetic biology without modeling, of course. In principle there is structure modeling and system modeling. In structure-modeling the conformation and structure of proteins is examined and steric consequences for reactions or the whole system can be estimated. We focused on the second sort of modeling: The systems modeling in which the reaction kinetics of the whole system is analysed and outcomes are predicted. Thus a synthetic biology approach can be chosen because a better understanding of the system is achieved and further changes can be planed - just like in engineering.
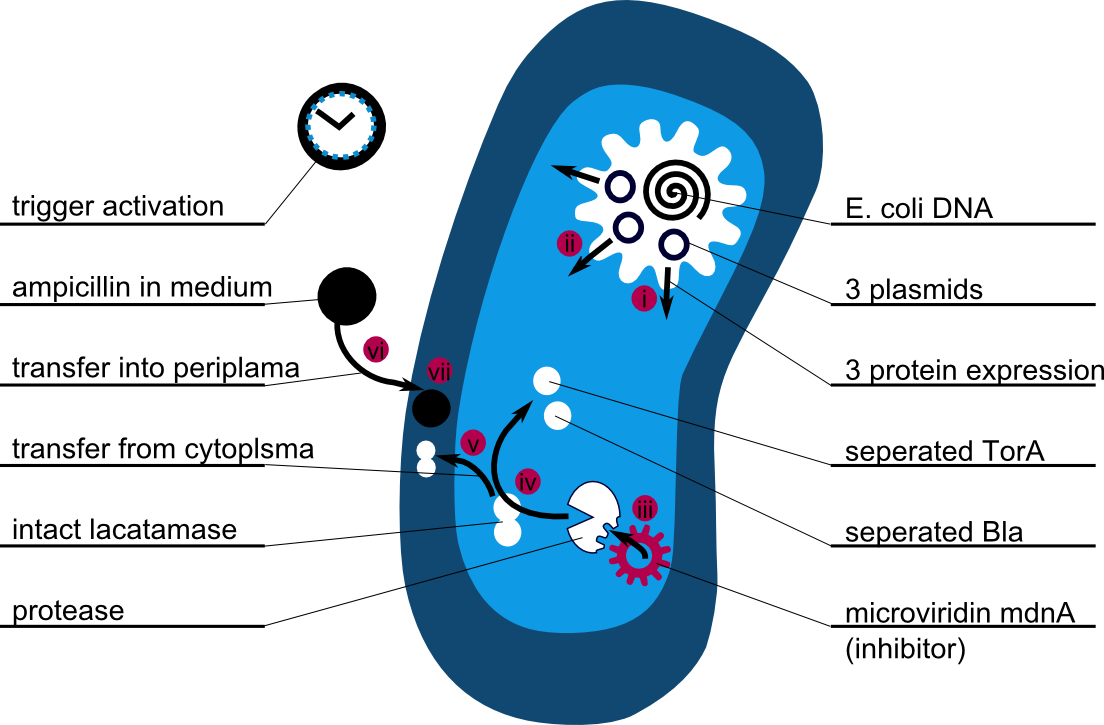
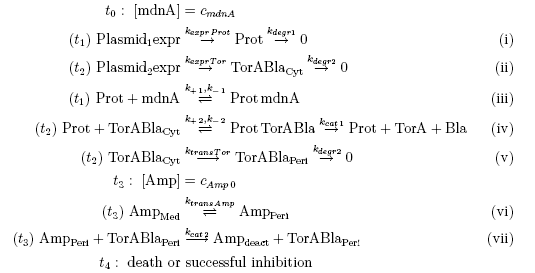
The following schema shows the major reactions taking place in our cell system. The Romanic numbers indicate the place of reactions that were written down as equations and then numerically propagated through time. We were able to see that our system works very well in theory. We learned about correct time-scales for our triggering and we were able to identify expected cell-division rates as a reference for the lab work.
The schema shows the triggered expression of mircoviridin (our inhibitor), the protease (that needs to be inhibited for medical reasons) and the lactamase (that is destroyed by the protease and works as an indicator for our system because it is a protection against ampicillin). There are three important trigger activation times:
. (t0) - beginn (microviridin added already)
. t1 - start expression of protease
. t2 - start expression of lactamase
. t3 - ampicillin added into medium
. (t4) - end of the experiment: cellcultures survive or die.
 "
"
