Team:Kyoto/Digestion/Modeling
From 2011.igem.org
Contents |
Digestion Modeling
We preformed modeling to improve usability of the results of Team Digestion. The aim of these modelings is the creation of the relationship of time and the cell population of E.coli and the concentration of chitinase and N-acetylglucosamin.
Stable phase model
At first, we defined these following equations. In defining these equations, we premised the following four things, that is,
- chitinase in medium isn't decomposed
- E.coli don't digest N-acetylgulcosamin
- chitin as substrate of chitinase is sufficient for reaction with chitinase
- E.coli don't grow.
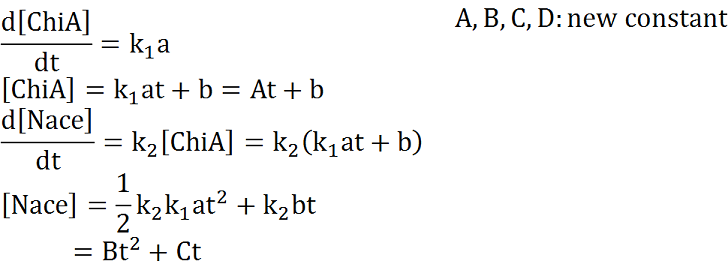
Two under equations of this figure show the production of citinase by E.coli and the decomposition reaction of chitin. In this decompositon reaction, the concentration of chitin isn't related because chitin is solid and don't dissolve in water.
We sought the answers of these equation by followig procedures.
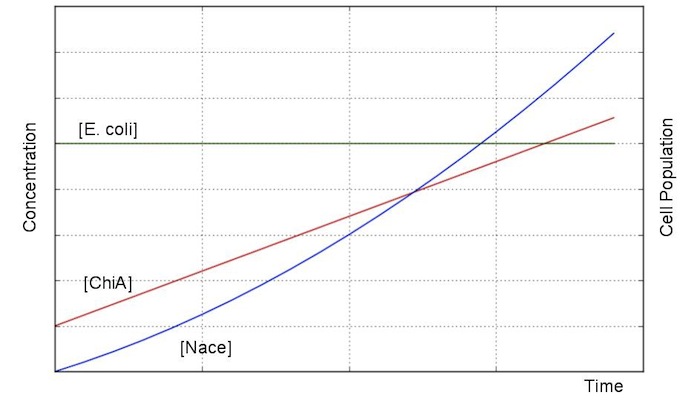
From these answers, we can get this graph.
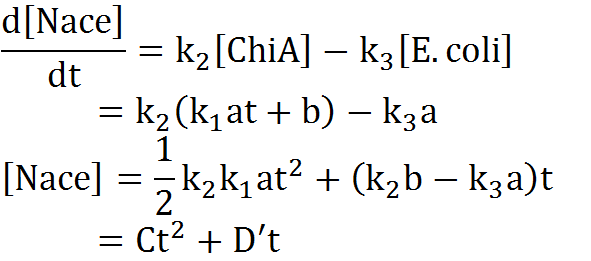
Second, we creat anothre graph. In this graph, E.coli digest N-acetylgulcosamin. In this model, following equatio was used.
Exponetial phase model
At first, we defined these things. In these premises
- chitinase in medium isn't decomposed
- E.coli don't digest N-acetylgulcosamin
- chitin as substrate of chitinase is sufficient for reaction with chitinase
- E.coli grow exponentialy
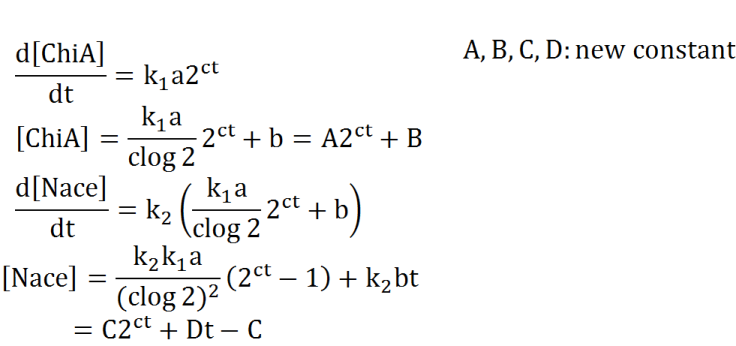
Two under equations of this figure show the production of citinase by E.coli and the decomposition reaction of chitin. In this decompositon reaction, the concentration of chitin isn't related because chitin is solid and don't dissolve in water.
We sought the answers of these equation by followig procedures.
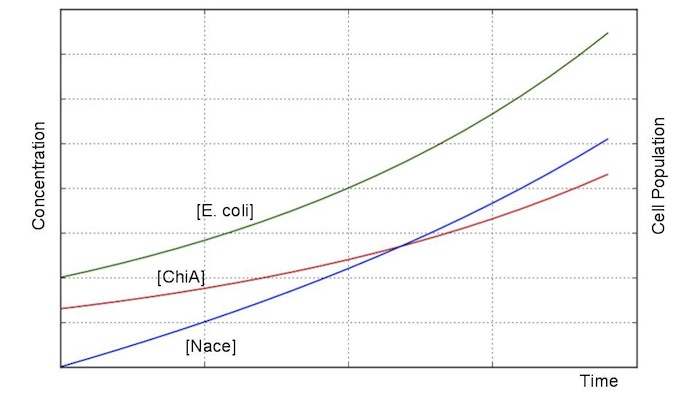
From these answers, we can get this graph.
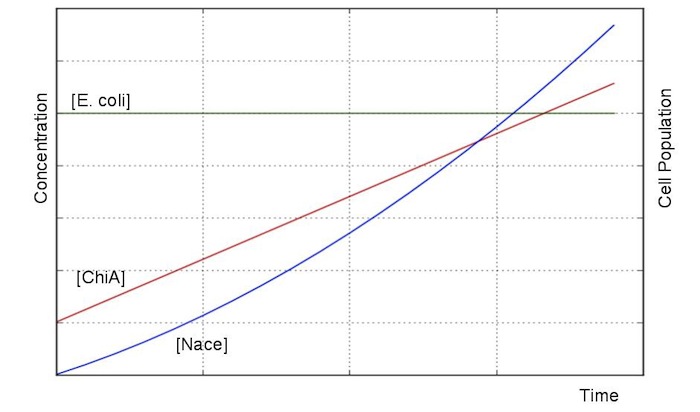
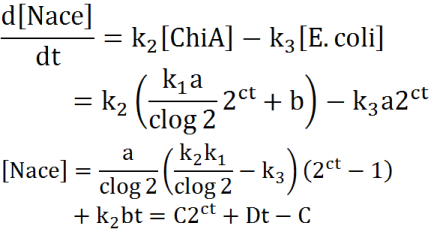
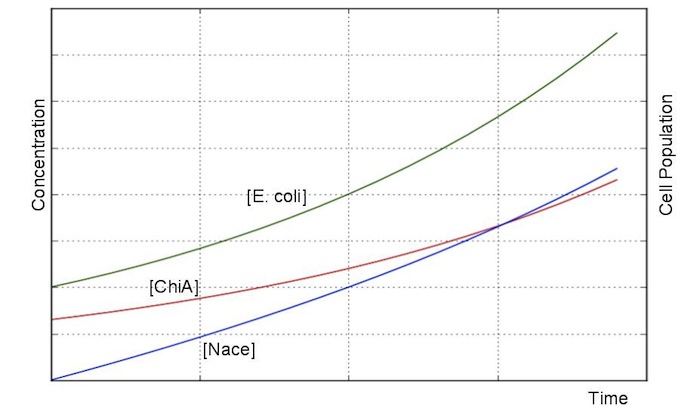
Second, we creat anothre graph. In this graph, E.coli digest N-acetylgulcosamin. In this model, following equatio was used.
 "
"


