Team:Cambridge/Experiments/Squid Dissection and Tissue Sample Improved Protocol
From 2011.igem.org
(→PCR Reaction) |
(→PCR Reaction) |
||
| Line 65: | Line 65: | ||
|} | |} | ||
| - | + | As we can see from the picture of the agarose gel, no products of PCR reactions, including the positive control, were detected. | |
| + | [[File:cam_extractionpart2_positivecontrol.jpg | 360px | center ]] | ||
Revision as of 14:21, 2 August 2011
Contents |
Amplification of Reflectin Genes from the Squid Genomic DNA - Part 2
Two new protocols for genomic DNA extraction were used in order to improve yield and purity of DNA. In addition to three sets of primers allowing for amplification of reflectin, an extra 'positive control' pair of primers was used in the PCR reaction.
DNA Extraction
As the previous attempt to amplify reflectin genes from Loligo vulgaris and Loligo opalescens failed mainly due to low concentration of template DNA, we decided to repeat the experiment, using two, presumably more efficient, new DNA extraction protocols:
- Sigma GenElute™ Mammalian Genomic DNA Miniprep Kit using 'Mammalian Tissue Preparation' procedure
- Improved version of the previously applied zebra fish protocol
Initial steps of the extraction procedure included:
- Tissue from L.opalescens was homogenized using a pestle and a mortar under liquid nitrogen. In this experiment, we did not extract genomic DNA from the second species, L. vulgaris, in order to save tissue material and reagents.
- Followingly, a spatula of powdered tissue was transferred to two reaction tubes with different concentrations of Proteinase K:
- GenElute™ protocol - 180 µl of Lysis Solution T and 20 µl of Proteinase K stock solution
- final concentration of Proteinase K = 2 mg/ml
- Zebra fish protocol - 198 µl of DNA extraction buffer and 2 µl of Proteinase K stock solution
- final concentration of Proteinase K = 200 µl/ml
- Samples were kept in a shaking water bath at 50-55°C
Measuring the Concentration and Purity of Extracted DNA
We measured the DNA concentration in the supernatant obtained with the GenElute™ Kit using NanoDrop Spectrophotometer.
- A260 = 3.89 and the calculated DNA content was roughly 194.5 µg/ml.
- DNA absorbs light most strongly at 260 nm and the absorbance value at this wavelength can be used to estimate the DNA using the following formula derived from Beer's Law:
- Concentration (µg/ml) = (A260 reading - A320 reading) x 50
- A320 provides a general measurement of the turbidity of the sample, but excessive values may indicate non-specific contamination.
- A320 of our sample was negligibly low so we used only A260 value for calculating the concentration.
- However, elevated absorbance at 230nm and a pink colouration of the solution indicates impurities.
- Guanidium salt used to facilitate DNA binding to silica column absorb strongly at 230 nm, thus high absorbances at this wavelength can be indicative of carry-over of this compound into the sample. Pink colouration is most probably caused by a high level of melanin in the sample, as squid tissues are considerably rich in this pigment.
Design of Positive Control Primers
In addition to three sets of primers allowing for the amplification of genes related to A1, A2 and B1 reflectins from Loligo pealei, we also decided to use an additional pair of primers that enabled as to perform a positive control reaction. For this purpose, we relied on primers that had been previously reported to successfully facilitate amplification of a 710-bp fragment of a mitochondial cytochrome c oxidase subunit I across a broad array of invertebrates, also including Loligo pealei (Vrijenhoek, 1994).
| Positive control primers | |
|---|---|
| 5' GGTCAACAAATCATAAAGATATTGG 3' | 5' TAAACTTCAGGGTGACCAAAAAATCA 3' |
This pair of positive control primers would allow us to verify whether the absence of any amplified reflectin genes would be due to improper PCR conditions or poor design of reflectin primers.
PCR Reaction
For all PCR reactions, genomic DNA extracted with the GenElute™ Kit served as a template, because we believed it was of higher quality than the DNA extracted using the zebra fish protocol.
The reactions we performed are presented in the following table and numbered according to their arrangement on the agarose gel during gel electrophoresis.
| Well | 1 | 2 | 3 | 4 | 5 |
|---|---|---|---|---|---|
| Reaction | L. opalescens genomic DNA A1 primers | L. opalescens genomic DNA A2 primers | L. opalescens genomic DNA B1 primers | L. opalescens genomic DNA mitochondrial primers | HyperLadder I |
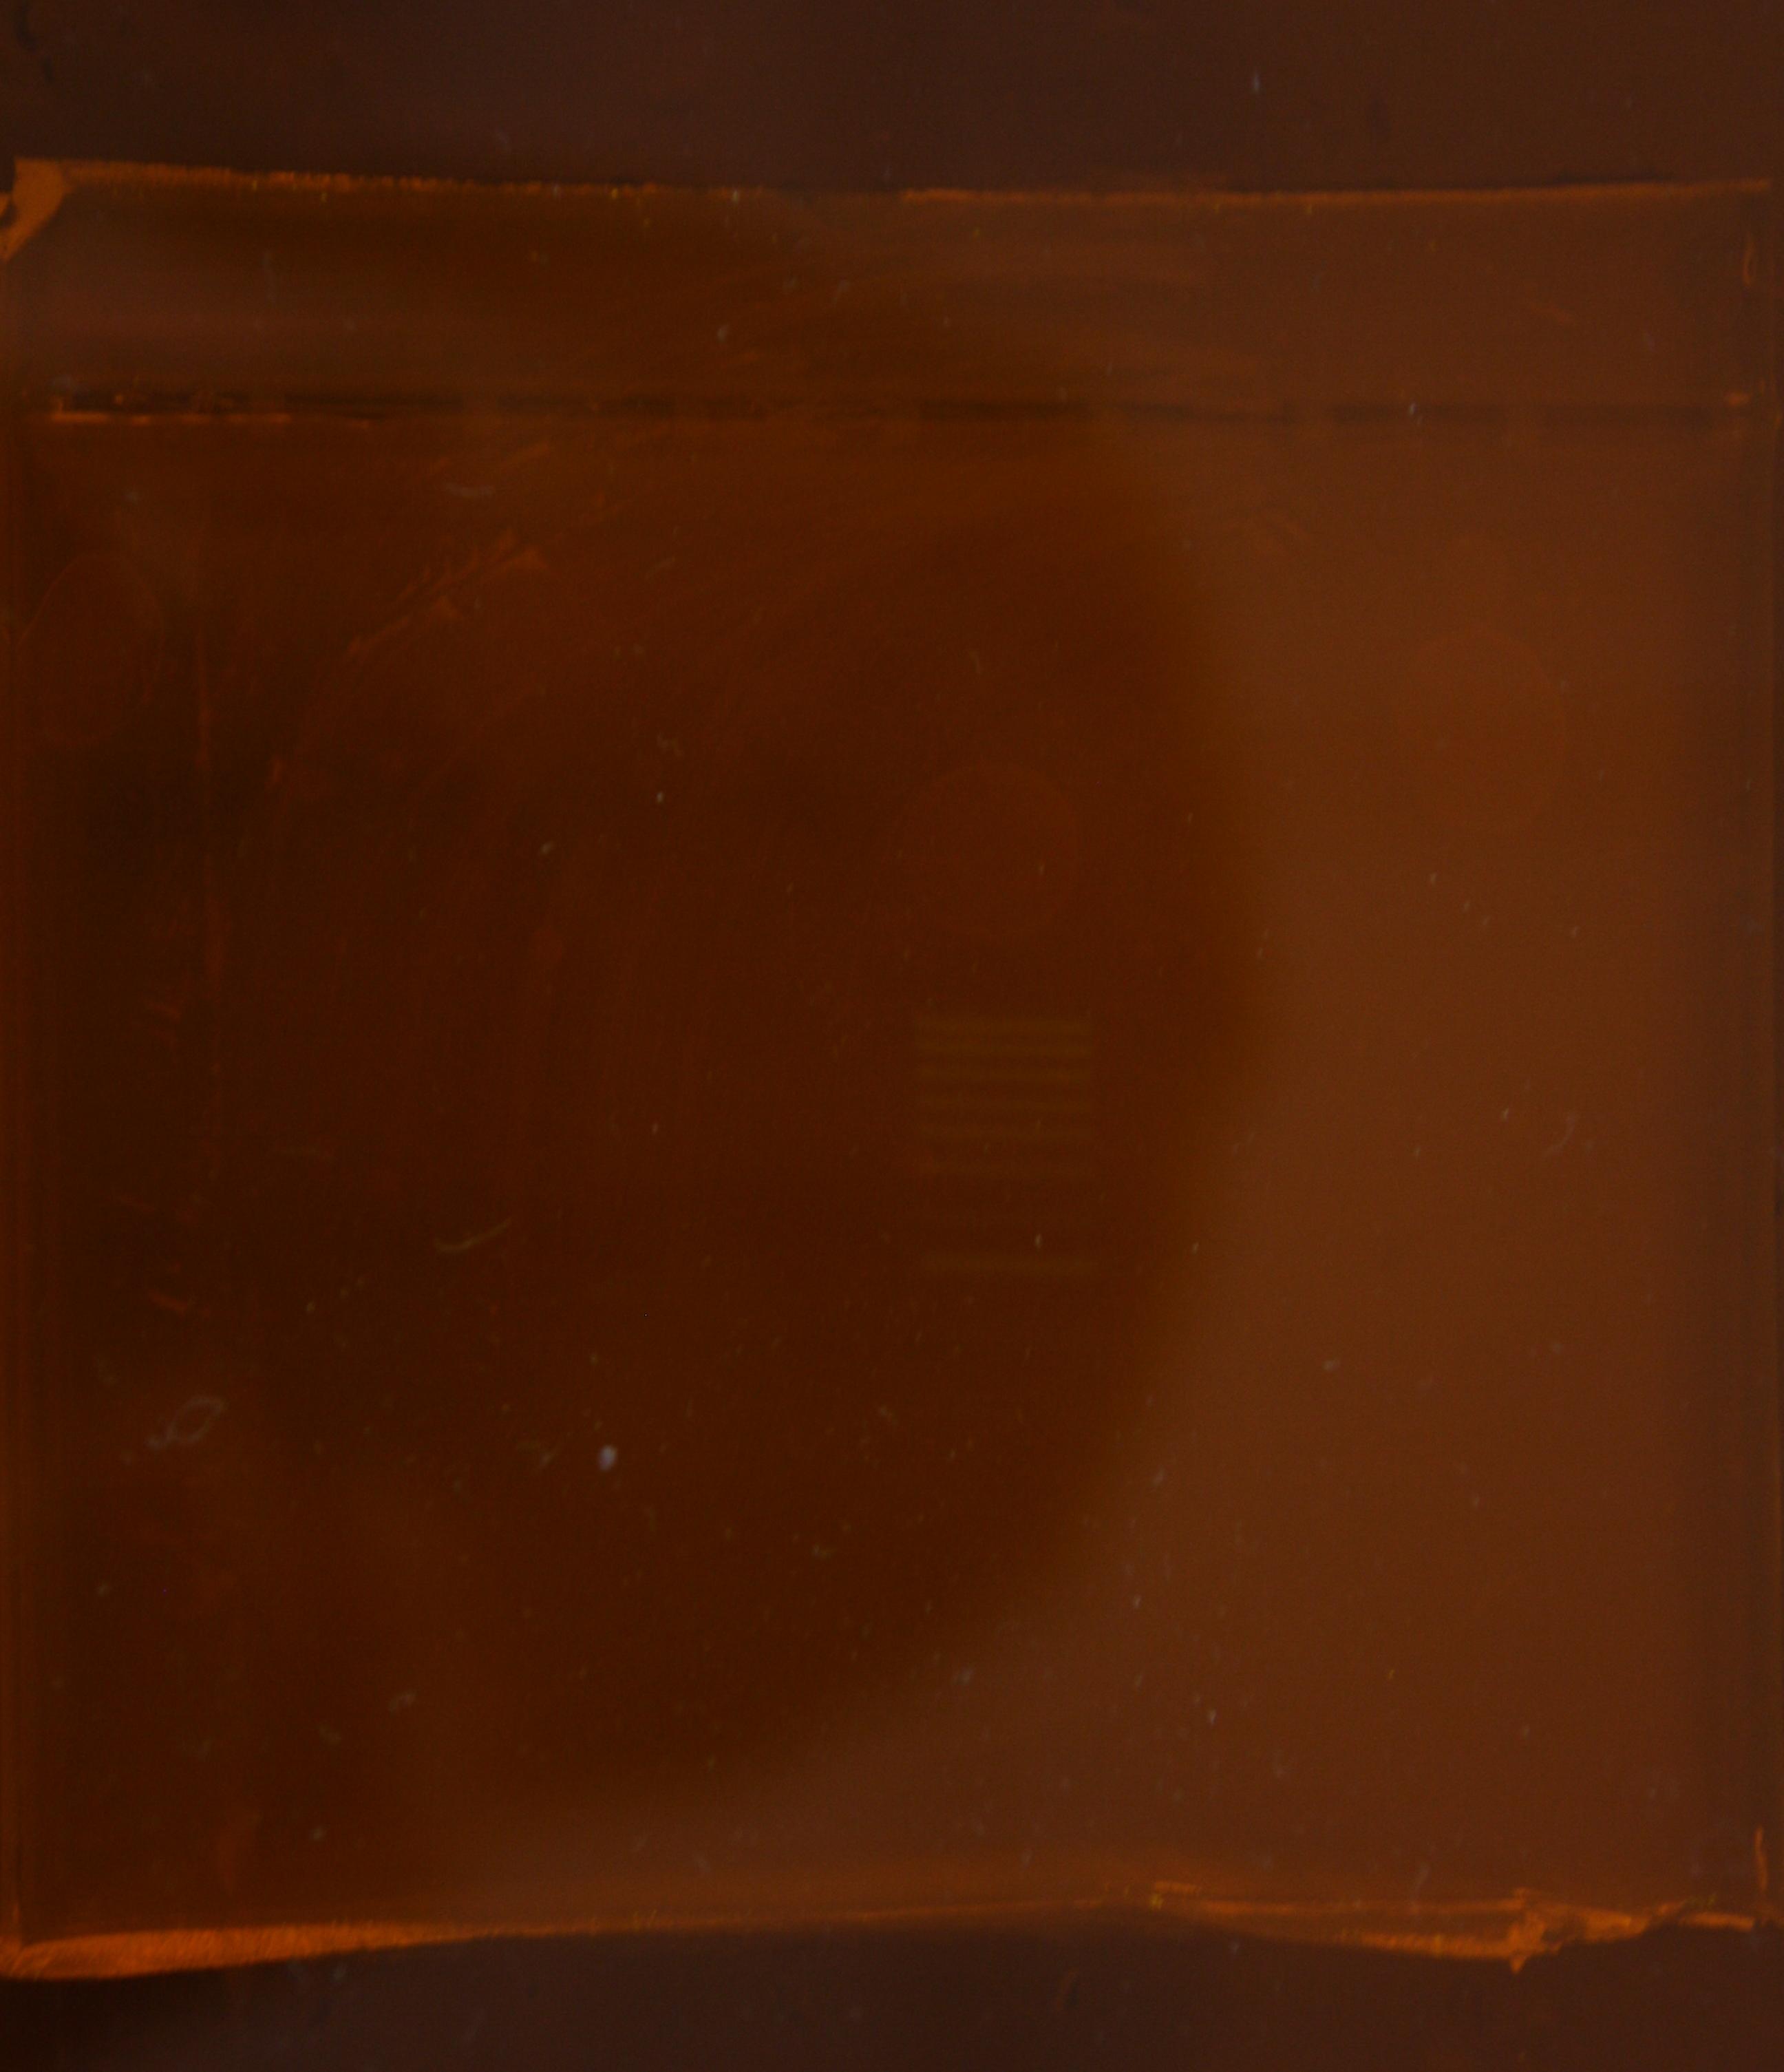
As we can see from the picture of the agarose gel, no products of PCR reactions, including the positive control, were detected.
• Picture of PCR - again no trace of amplified rflectin - no detectable primers and template DNA
○ Order of samples 1:A1, 2:A2, 3:B1, 4:+, 5:Ladder IV
○ No visible bands in the gel (apart from the Ladder IV)
○ Positive control does not work - although in the cited paper, successful use in Loligo pealei is shown
○ Suggests that the prepared DNA was not sufficiently clean
• As we read in some papers (reference), difficult to work with genomic DNA from squids and other cephalopods.
References
- Vrijenhoek R. (1994) DNA primers for amplification of mitochondrial cytochrome c oxidase subunit I from diverse metazoan invertebrates. Molecular Marine Biology and Biotechnology, 3(5): 294-299.
 "
"

