Team:Calgary/Project/Promoter/Bioinformatics
From 2011.igem.org
Rpgguardian (Talk | contribs) |
|||
| Line 101: | Line 101: | ||
<p>THIS SECTION SHOULD CONTAIN CHARACTERIZATION FOR THE PROMOTER, IF IT EXISTS.</p> | <p>THIS SECTION SHOULD CONTAIN CHARACTERIZATION FOR THE PROMOTER, IF IT EXISTS.</p> | ||
--> | --> | ||
| - | + | <style> | |
| + | #titlebar{margin-top: -6px;} | ||
| + | #pagetitle{padding-top: 17px;} | ||
| + | #bodycontainer{padding-top: 6px;} | ||
| + | </style> | ||
</html> | </html> | ||
}} | }} | ||
Revision as of 20:46, 28 September 2011





NA-Sensitive Promoters using Bioinformatics and qRT-PCR

Introduction
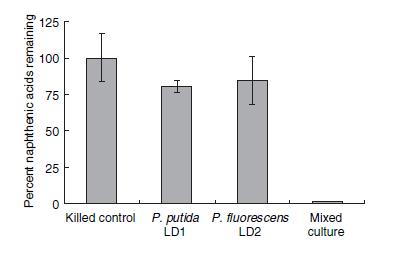
Numerous species of bacteria have been found to survive in the highly toxic environments of the tailing ponds. However, only recently environmental researchers have begun to identify the strains and species of these microorganisms. In a recent study directed by Moore et al. 2006, two species of Pseudomonas (putida and fluorescens) were shown to degrade naphthenic acids in co-culture to a much greater degree than culturing each species individually. The percentage of remaining naphthenic acids in a solution after four weeks of bacteria culturing is shown in Figure 1.
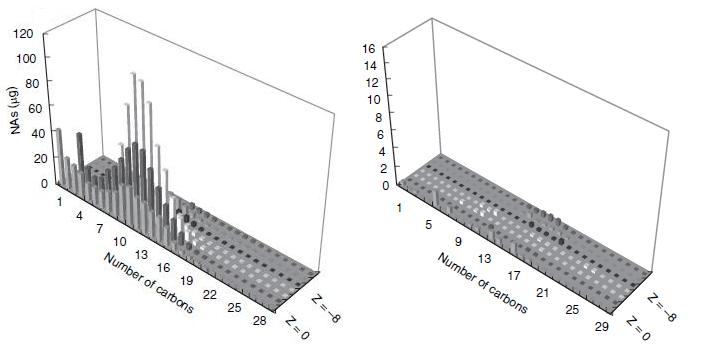
This result would suggest that each strain of Pseudomonas provides a unique set of degradation machinery (likely in the form of enzymes) to complete the breakdown of naphthenic acids. Figure 2 shows how the degradation affected the concentrations of specific naphthenic acids of varying carbon number and saturation, as measured by GC-MS. The chart on the left of figure 2 shows the initial concentrations of each of the naphthenic acids, and the chart on the right shows the concentration of the naphthenic acids after four weeks of a LD1-LD2 co-culture. Based on the decreased height and scale, the figure demonstrates that naphthenic acids were more or less indiscriminately degraded by the co-culture. In terms of the development of a detection system for naphthenic acids, the indescriminate nature of this degradation would be advantageous in detecting a large group of NA's.
Figure 2.
When both figure 1 and 2 are taken together, the most likely conclusion is that the genes responsible for the degradation are spread across the two species. Furthermore, there exists a collection of essential genes in this degradation pathway which are unique to one species and not present in the other. The degradation pathway has not been experimentally confirmed, but it is believed to be some sort of metabolic pathway which involves beta-oxidation (Moore et al. 2006). In any case, the promoters upstream of these essential genes would be a likely place to find a naphthenic acid promoter - and indeed, our later experiments found that they were. A weakness of the bioinformatics search was that LD1 and LD2 have not yet been sequenced, and therefore we assume similarity between them and corresponding strains that have been sequenced; this weakness complicated primer design but was not prohibitive to the project.
Abstract
Three online algorithms (DarkHorse, ProteinWorld DB, and Pseudomonas.com) were used to find target gene candidates in silico, and a fourth (MUMmer ) was used to confirm experimental hypotheses. Using the data from these sources, we were able to construct a short list of gene candidates which were then processed through a quantative Real-Time Polymerase Chain Reaction (qRT-PCR) to verify gene expression as a response to naphthenic acids. The qRT-PCR found that a putative Enoyl CoA Hydratase (GeneID=YP_260124), from Pseudomonas fluorescens, was expressed as a response to naphthenic acids.
The characterization of its promoter can be found below.
DarkHorse and ProteinWorld DB Results
DarkHorse is an online database for finding phylogenetically atypical proteins in various microbial species. Generally, phylogenetic atypicality can be useful for predicting the horizontal transfer of genes; in this bioinformatics survey, this also functions to provide a list of relatively unique genes in each of the strains in Pseudomonas putida and fluorescens. This assumes that the metabolic pathways we are interested in identifying were transferred from other species known to be able to degrade naphthenic acids. Additionally, the program only uses genomic DNA and does not include any of the super plasmids known to be carried by different strains of Pseudomonas. These limit the scope of our screen however can provide useful insights into the ability of other tailings ponds species to transfer their metabolic networks.
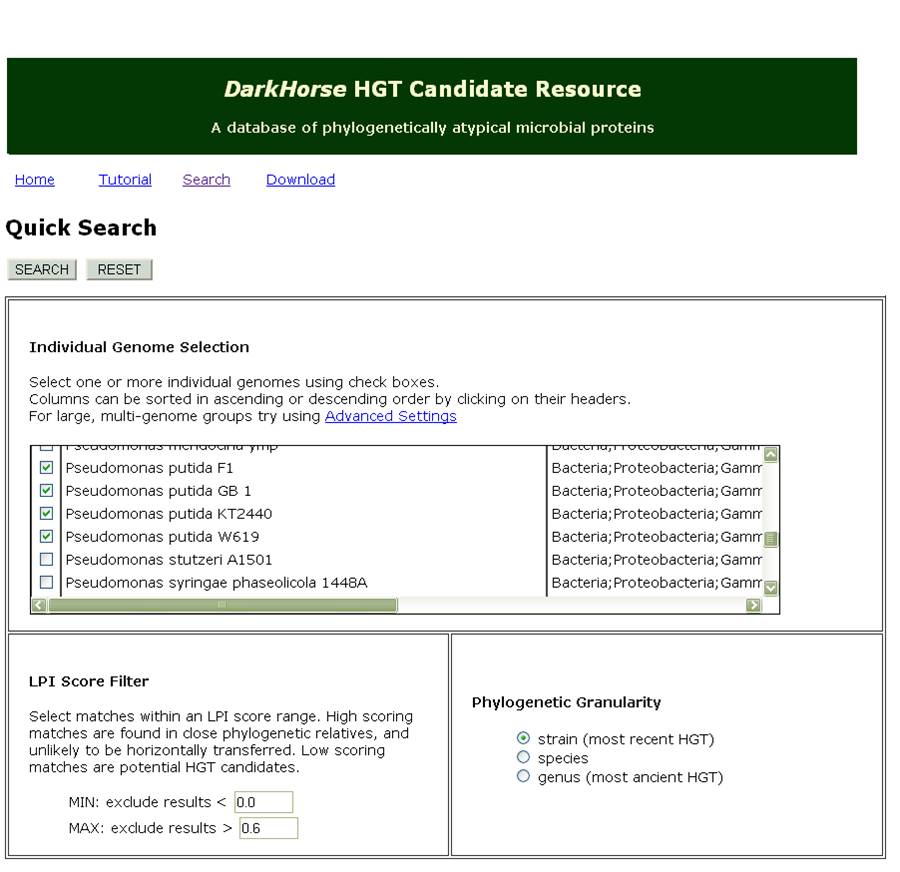
Figure 3 shows a sample of the input used for our DarkHorse Query. The list returned by querying the database for genes in LD1 and LD2 was 258 records long. Each record contained the GI number, strain, and gene annotation for the query species and its best phylogenetic match. To sort through the data, we started by collecting data about the best match species and the gene annotations. Using the data about the species, we found that some of them had known degradation pathways and were naturally occurring in tailings ponds. We were especially interested in such species when they donated a predicted transcription factor or degrative enzyme related to fatty acid degradation. Fatty acids are structurally similar to naphthenic acids and therefore may have similar promoters, or enzymes that would interact with this class of compounds. We also chose to short-list enoyl CoA hydratase due to its very low RPI score (0.001) suggesting it was very likely to have been horizontally transferred and a recent paper (Fiedler et. al. 2004 Journal of Applied Microbiology) suggested that this class of hydratases are known to degrade similar compounds such as caffeic acid and cinnanoic acid. A predicted Acyl-Coa-ligase with a LPI score of 0.401 was also shown to modify and degrade caffeic acid and therefore was added to our list of genes we were interested in testing. To view our Darkhorse bioinformatics results as a whole please click here.
Additionally we used Protein World DB, a database for finding unique genes across a set of compared species. This program was useful for identifying potential metabolic genes which would be found in one of the organisms but not in the other, which our original prediction suggested would be the case with Pseudomonas putia and fluorescens. The program used the only available Pseudomonas strain in their registry KT2440 for putida and fluorescens strain Pf-5.

Picture showing the layout of the ProteinWorld database website. Source: <a href="http://darkhorse.ucsd.edu/search.shtml">http://darkhorse.ucsd.edu/search.shtml/</a>.
This program returned 55 unique hits for both species of bactera. Visual inspection and classification of these hits revealed a number of transcription factors known to be involved metabolic signalling in a variety of other organisms. In particular, two LysR based transcription factors, and a theoretical protein seemed to BLAST against other known transcription factors found in various species of bacteria. What was interesting, was the involvement of these transcription factor hits in metabolic pathways particularly in Beta-oxidation. For this reason, we added these to a list for further examination. A thioesterase which was might also be involved in naphthenic acid degradation was also short-listed onto our list. Please click here for a complete list of our Protein World DB hits.
After examining both the DarkHorse and Protein World DB hits, our team was able to short-list six genes which we thought to be potentially involved in naphthenic acid detection and potentially degradation. These genes are listed below:
Quantative RT-PCR Results
In order to validate that our short-listed genes were involved in naphthenic acid sensing, we designed and implemented a qRT-PCR approach to analyzing changes in mRNA expression for these genes in the prescence of naphthenic acids. Cell cultures of LD1 and LD2 were grown in minimal media in mixtures containing either 80mg/L of naphthenic acids or Casamino acids. We used several kits from Qiagen, including RNA Protect and RNEasy, etc. 16s rRNA, a constitutively expressed conserved gene found in both LD1 and LD2, was used as a control for the experiment.
Primers for the Polymerase Chain Reaction (PCR) were designed with the following guidelines in mind:- Melting Temperature: 70-74°C (optimally 72°C)
- Primer Length: 22-24 (optimally 24)
- Product Length: 150-250 base pairs (optimally 200)
- No runs of 4 or more of the same nucleotide letter in either the forward or reverse primer.
- The primers have a GC clamp at the end (ie. end with G, C, GC, or CG)
- The last 5 nucleotides contain 3 or 4 GC's.
- GC Content between 40-60% (optimally 50%)
- All unintentional matches calculated using Primer Blast are at least 25% mismatched.
Appendix A: Pseudomonas.com Results
The genes found from a subsequent bioinformatic search on Pseudomonas.com were not used in the RT-PCR, but have been included as an appendix for the iGEM community. Pseudomonas.com is a database specializing in the annotation and collection of information related to the Pseudomonas genus, but it also has a comparative genome search tool which claims to allow the location of genes unique to one species and not the other. The list, which has not been completely processed yet, can be found in this .zip file in both .xls and .xlsx format (the latter is recommended). One of the most interesting genes found on the list is annotated as glyoxalase/bleomycin resistance protein/dioxygenase, but is similar to a ring-cleaving dioxygenase also found in putida.
Appendix B: MUMmer Findings
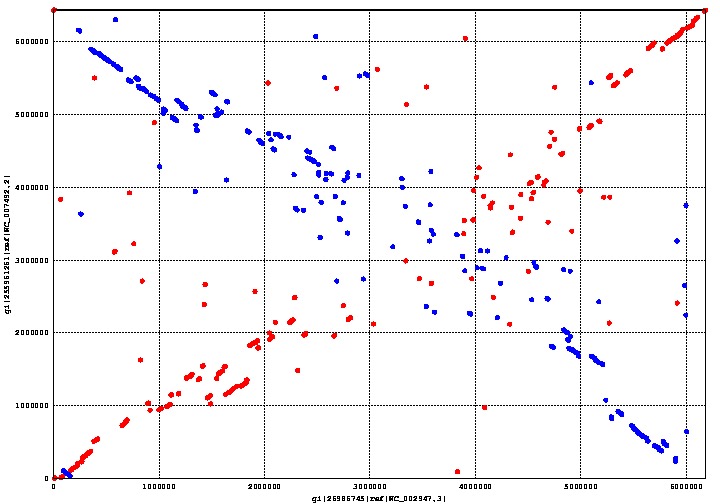
MUMmer is an open source program which can align genomes within a matter of seconds. We used MUMmer to verify our assumption that there was a substantial degree of homology between Pseudomonas putida and fluorescens. This assumption is important, because its corollary is that there is a limited number of genes unique to either species. The fewer unique genes there are, the easier it is to find the right one.
The graph above shows the genome alignment between Pseudomonas putida and fluorescens, where the earlier is on the x-axis and the latter on the y-axis. Regions conserved between both species form a straight line going from the bottom left corner to the top right corner; the line going from the top left corner to the bottom right corner is also a conserved region between both species, except that it is backwards. Areas with a more scattered distribution indicate a more random, and therefore less homologous, aligned region between the two species.

 "
"


