 "
"
File:UP 3Dplot Lact 06.png
From 2011.igem.org
Revision as of 10:28, 13 October 2011 by TobyWenzel (Talk | contribs)
No higher resolution available.
UP_3Dplot_Lact_06.png (655 × 469 pixels, file size: 39 KB, MIME type: image/png)
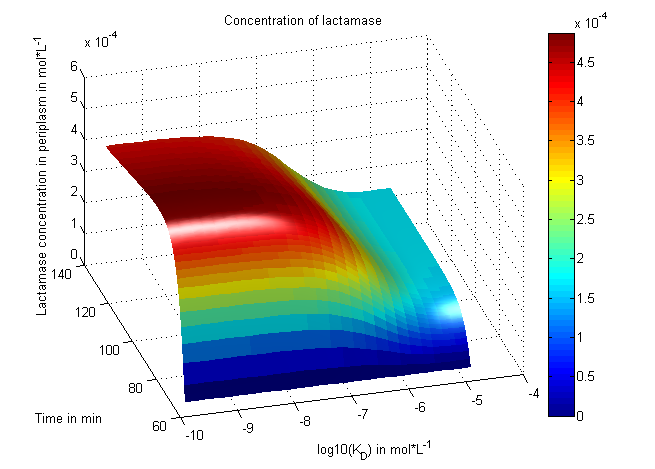
plot tat shows the lactamase concentration inside the periplasm in dependence of the Enzyme reaction factor K_D
File history
Click on a date/time to view the file as it appeared at that time.
| Date/Time | Thumbnail | Dimensions | User | Comment | |
|---|---|---|---|---|---|
| current | 10:28, 13 October 2011 | | 655×469 (39 KB) | TobyWenzel (Talk | contribs) | (plot tat shows the lactamase concentration inside the periplasm in dependence of the Enzyme reaction factor K_D) |
File links
The following 2 pages link to this file: