Team:ETH Zurich/Biology/Validation
From 2011.igem.org
| Validation |
| ||||
| Experimental setups... | |||||
AlcR sensorTest systemAs described in the Smoke detectors section we designed two artificial AlcR-dependent promoters which get repressed upon binding of AlcR to acetaldehyde. For testing of our design we created a system with a superfolded GFP output in order to characterize the gene expression with different levels of AlcR production and acetaldehyde induction. The system work the following way: A) In normal medium conditions the TetR transcription factor is produced and binds to its cognate promoter, thus inhibiting the expression of alcR. In this case no AlcR is present and GFP is produced. B) Upon addition of increasing amounts of anhydrotetracycline, TetR gets released from the promoter and AlcR is produced. The amount of AlcR should increase with increasing amounts of anhydrotetracycline. C) By addition of acetaldehyde AlcR binds to the alc-promoter and the GFP response decreases.
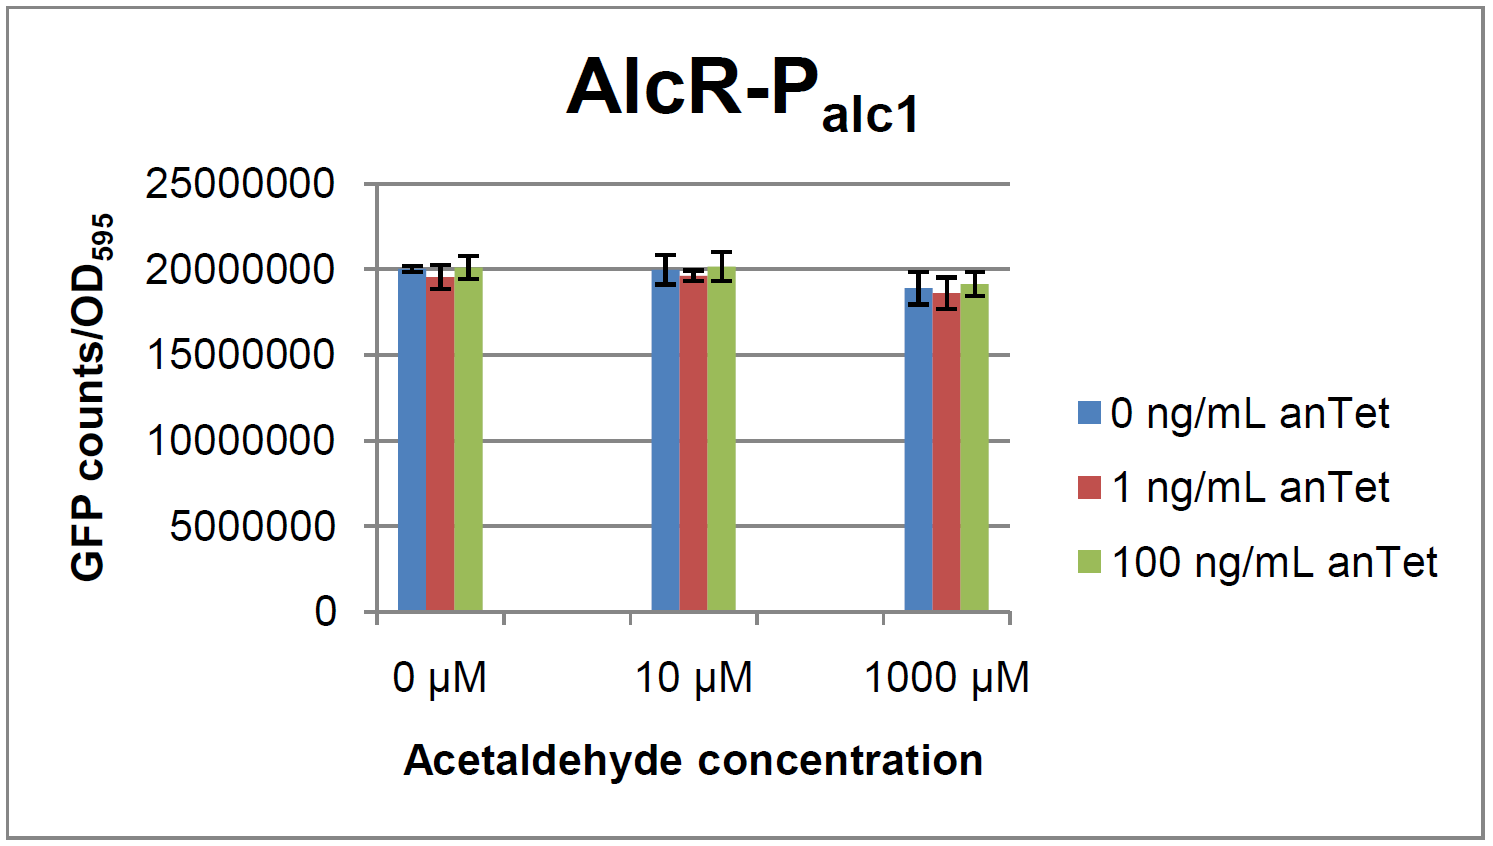
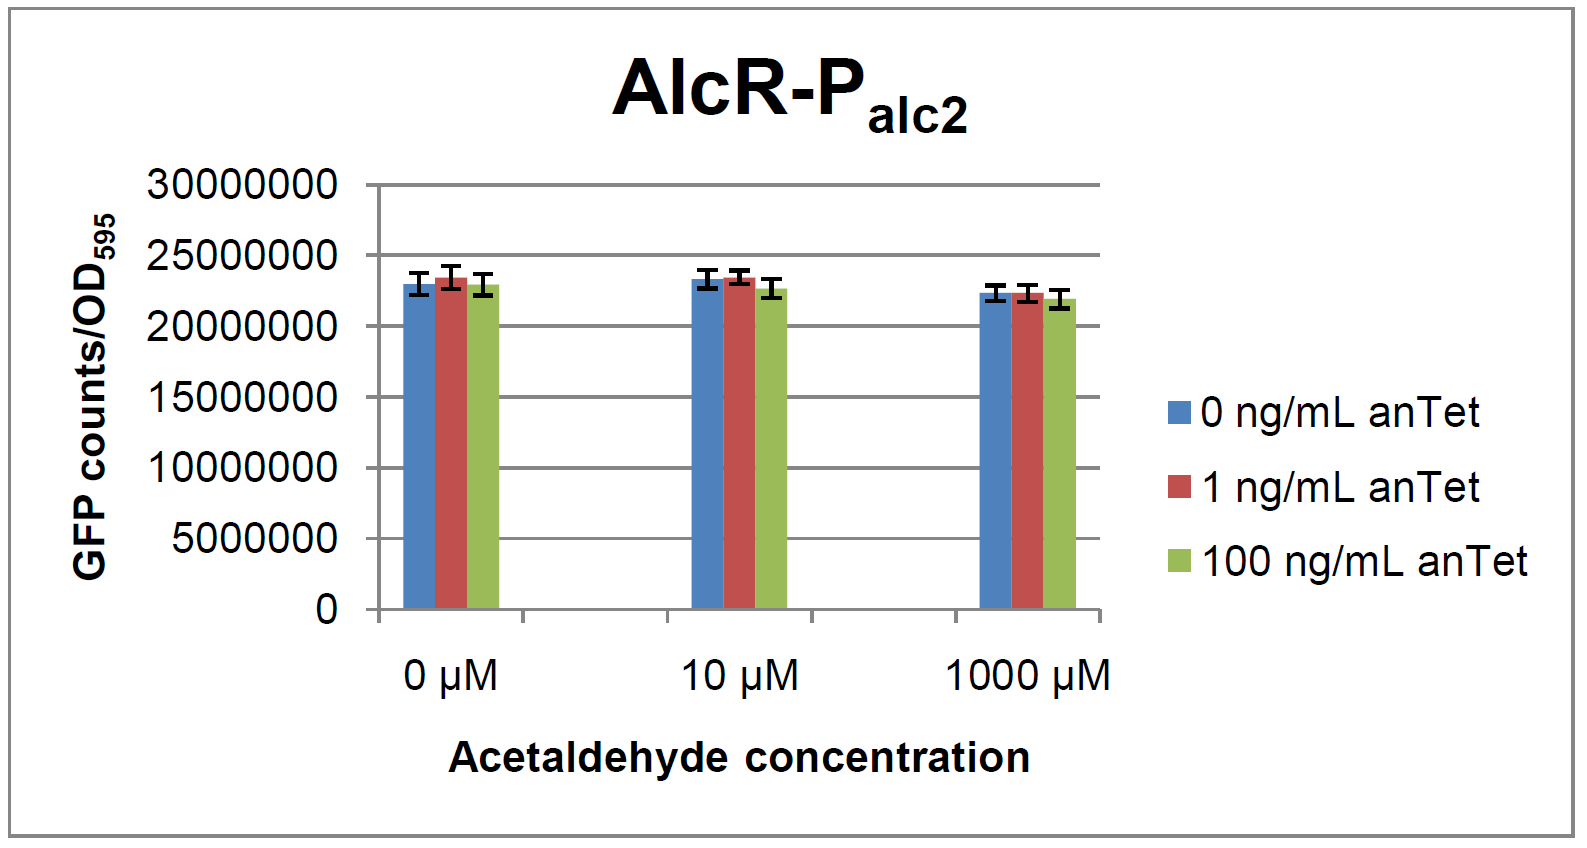
Experiments and resultsIn a first experiment, the alc-promoters were tested by using a non-codon optimized natural variant of alcR. Because of this we tested the compatibility of the codon usage in the variant from Aspergillus nidulans with the one from E. coli. We received a codon adaptation index (CAI) of 0.7 [2]. Nevertheless, some rare codons in E.coli were present in the first 20 amino acids of the gene. After a first experiment without any significant results (data not shown), we therefore optimized the 20 first amino acids of alcR by PCR and also ordered a fully codon-optimized variant. All of the following experiments were performed with alcR codon-optimized within the first 20 amino acids. The AlcR test was established as a two plasmid system containing ampicillin and kanamycin resistances and pMB1 respectively pSC101 origins of replication. These plasmids were co-transformed into E.coli JM101 strain. M9 medium was inoculated with an overnight culture of the strain. The bacteria were induced with different amounts of acetaldehyde (0, 10, 1000 µM) and anhydrotetracycline (0, 1, 100 ng/mL) during the exponential growth phase. In order to avoid evaporation of acetaldehyde, all equipment was cooled down to -20 degrees prior to preparation of the stock solutions. All solutions of were afterwards prepared in tubes at 4°C. Finally, the cell suspension was added to the solutions and the tubes were tightly closed to prevent loss of acetaldehyde. Fluorescence and OD measurements were performed in a 96-well plate several hours after induction.
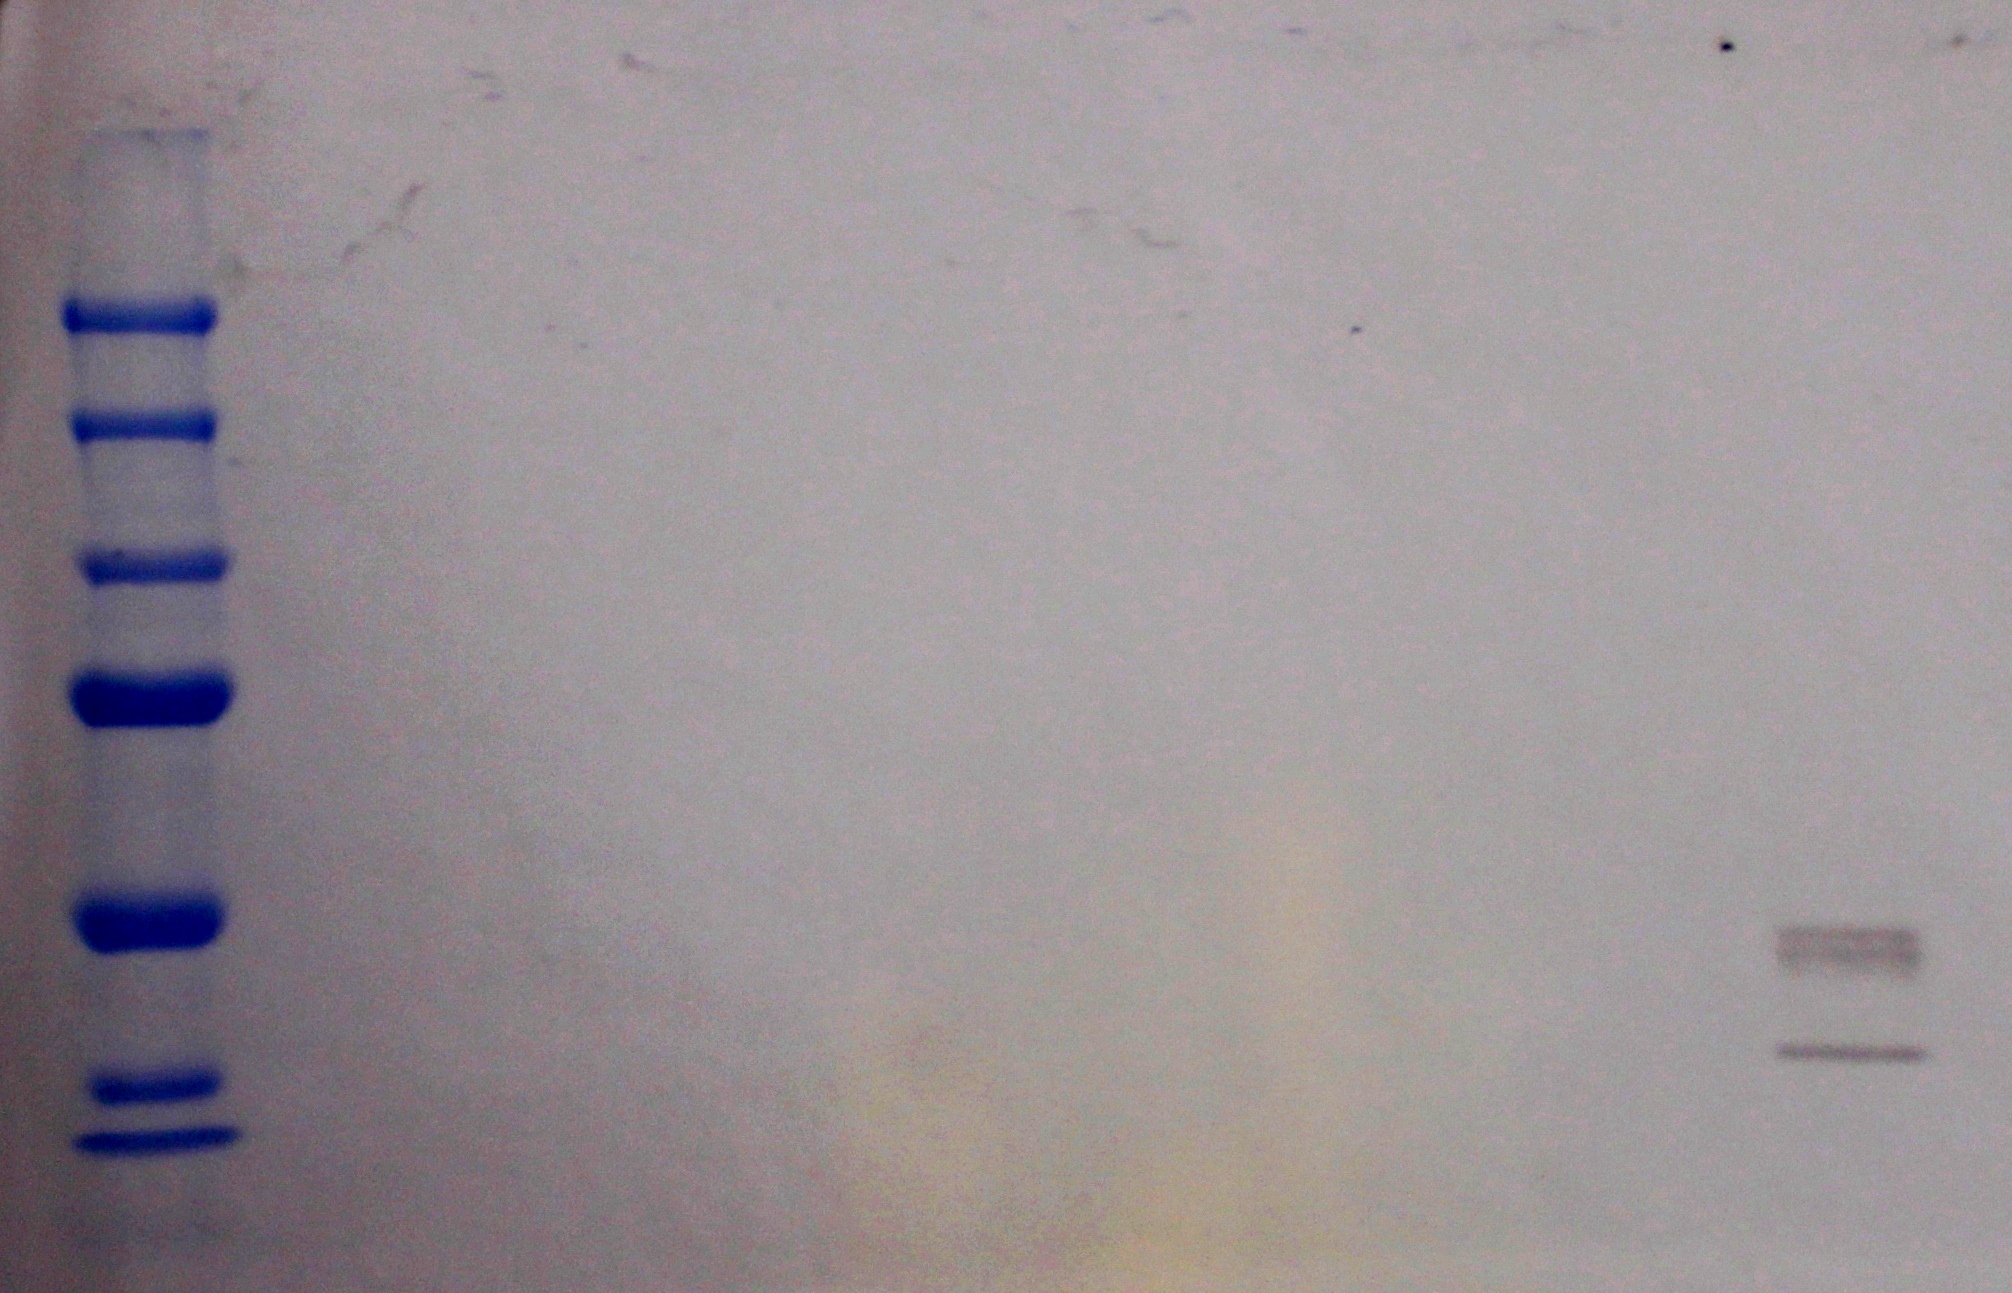
As visible on the two images above, no significant change in GFP fluorescence could be observed neither between different acetaldehyde concentrations nor between different AlcR induction levels. Because of these negative results and the non codon-optimized alcR we performed expression tests for the protein in E. coli strain JM101. In these experiments, gene expression was induced with different amounts of anhydrotetracycline during the exponential growth phase of the bacteria. After cultivation, cells were harvested and lysed either by using a Retsch mill or by lysozyme. After resuspension of the cell extract we performed both SDS-PAGE gels and western blots to check for alcR expression. Buffer was added to the cell debris and heated to 95°C for 10 minutes in order to resolubilize potential inclusion bodies. AlcR has a molecular mass of about 96kDa and thus its band was suspected to be on the same level as the red box marked in the SDS-PAGE gel. Despite increasing amounts of anhydrotetracycline (wells 1 and 3: 0 ng/mL, 2 and 4: 1 ng/mL, 3 and 6: 100 ng/mL) no change could be observed in this area of the gel for any of the probes. A reason for this could be that alcR is not expressed at all. To check again whether alcR is expressed at all we performed a western blot. Therefore, a 6x His-tag was added to the C-terminal end of AlcR and we used a anti-His antibody kit in order to detect it. A probe with another concentrated 6x His-tagged protein was added as positive control so that we could exclude systematic errors during the blotting procedure. |
XylR sensor |
Xylene degradation |
Bandpass |
References[1] [http://www.ncbi.nlm.nih.gov/pubmed/11550794 Beatrice Felenbok, Michel Flipphi and Igor Nikolaev: Ethanol Catabolism in Aspergillus nidulans: A Model System for Studying Gene Regulation, Progress in Nucleic Acid Research and Molecular Biology, 69: 149-204] |
 "
"


