 "
"
Team:Glasgow/Results
From 2011.igem.org


Results
Collated here are the results from numerous experiments that have been performed for the DISColi project. Detailed information about the biobricks we made is contained in links in the details of the experiment in which they are used.Properties of P. Aeruginosa Biofilms
Aims1. Determine quantitatively the base rate of dissociation from a biofilm. This rate can be compared to the novel biofilm dispersing biobricks rate of dispersal to determine their effectiveness. 2. Examine the structure of biofilms after set periods of time. These images can be used to compare the 3D structure of Nissle 1917 biofilm.
|
Method
As we were trying to specifically disperse areas of biofilm it was necessary to establish a base rate of dispersal of the biofilm without using any of the dispersal mechanisms we designed. This would allow us to show quantitativly the increase in rate of dispersal that our different dispersal biobrick could generate when compared to a biofilm of non-transformed bacteria. To measure the base rate of dispersal glass slides were put into 50ml tubes containing 20ml of LB broth. The LB covered around a third of the glass slide, this is the area where the biofilm would form. The LB was then inoculated with 20μl of overnight culture of Pseudomonas aeruginosa. These tubes were then left on a bench top shaker at room temperature for a set amount of time (time points ranged from 1hr to 48hrs). After the biofilm had grown its alloted time the glass slide was carefully removed and placed into a fresh 50ml tube with 25ml of LB (which completely covered the biofilm) and left to allow the bacteria to disperse for 1hr. The slide was then transferred to a fresh 50ml tube with 25ml of LB. The biofilm is scraped off the slide using a thin flexible spatula. At this point both the dispersed cell and the biofilm scrapings were sonicated to stop clumping and plated in serial dilutions. |


Figure 1: Number of viable cells in biofilm compared to number of cells dispersed from the biofilm in one hour. The base rate of dispersal remains roughly proportional to the number of cells in the biofilm. The data for the time point hour 14 for the biofilm was not available. |
To make the images of biofilm formation, biofilms were formed on glass slides inserted into 50ml tubes. The tube was filled with 20ml of LB broth and inoculated with 20μl of over night culture of Psuedomonas Aeruginosa. The biofilms were left to form for the time indicated on the images.
ResultsBase Rate Dispersal of E.coli Nissle 1917
The time series was carried out with Nissle (details see lab books) the same way as detailed for P. aeruginosa above. It showed that on average 48% of the cells within a biofilm will disperse once the biofilm is transferred into fresh media. The percentage dispersed was expected to be inversely correlated to the size of the biofilm, because we expected a larger biofilm to have a higher affinity for the cells it holds. However, the data shows that the percentage dispersed is relatively constant, and varies between 30-60% dispersal.
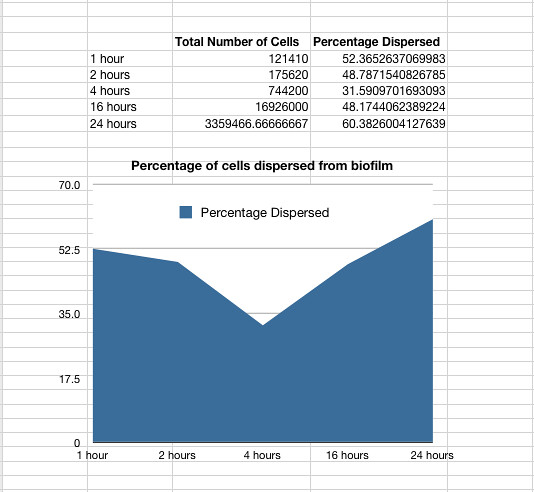
Graph 1: The total percentage of cells dispersed when a biofilm is transferred into new media vs time in hours
The data also showed that over time the amount of cells firmly within a biofilm increases at a similar rate to those that disperse and are not attached to the biofilm.
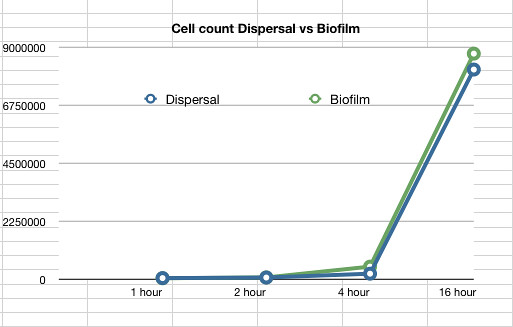
Graph 2: The estimated number of dispersed cells compared to the number of biofilm cells vs time in hours
View the full spreadsheet of E.coli Nissle 1917 dispersal here
We have successfully created chemically and electrically competent E.coli Nissle 1917, and transformed them with RFP for proof of principle - and because it enhances biofilm documentation, as can be seen in Picture 2 below.
Since Nissle have proven to be transformable, and have distinct biofilm-forming abilities we have made the cells available to the Registry as a novel chassis for use in further research and projects involving biofilms.
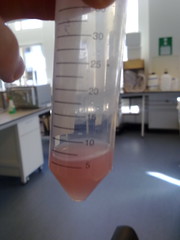
Picture 1: RFP transformed E.coli Nissle overnight culture |
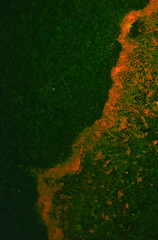
Picture 2: A 24-hour biofilm of RFP E.coli Nissle |
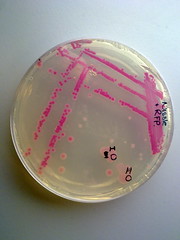
Picture 3: Streaked RFP transformed E.coli Nissle |
Surfactants
Modelling
The results regarding the biofilm dispersal we acquired using our single-cell models and some additional values are shown in the table below. We also created models for Phosphodiesterase activity and the multi-cell models for Latherin and Colicin E2. For more information, please refer to Modelling site.
| Name of the molecule | Diffusion rate (mm2/min) | The critical concentration (molecule) | Achieving Effective Concentration* (min) | The attainable spatial resolution (mm) |
| Ranaspumin-2 | 1.68*10-4 | 374 | 28 | 0.09 |
| T4 Endolysin | 1.52*10-4 | 3000 | 52 | ~0.01 |
| Latherin | 1.38*10-4 | 173 | 29 | 0.08 |
| Colicin E2 | 0.72*10-4 | 1629 | 90 | ~0.01 |
Here there are the two equations we used to determinate diffusion of the molecules through a biofilm:

Equation 1
where:
P (r,t) – number of molecules at the certain distance after a certain time
A – total number of molecules in the system
r – distance from point of origin (mm)
D – diffusion coefficient
t – time (min)

Equation 2
where:
Pf (r,t) – Final number of molecules at given distance at given time
P (r,t) – initial number of molecules according to Equation 1
λ – rate of degradation (molecule/min)
t – time passed (min)