Team:WashU/Notebook/Assay
From 2011.igem.org
Assay Group
We based our assay procedure from "Carotenoid Analysis" procedure from “High-Level Production of Beta-Carotene in Saccharomyces cerevisiae...” Verwaal et. al (2007) We made several modifications to the procedure to meet our needs, yeast strains, beta carotene/beta ionone concentrations, and efficiency expectations.
1. Pellet yeast cells by centrifuging for 5 minutes at 10,000g.
2. Discard supernatant. Resuspend cells in 1mL sterile H2O. Vortex for 10 sec.
3. Add 1 g 0.50-0.75mm glass beads. Vortex for 5 min to break cells.
4. Add 2.5 mL of 0.2% (wt/vol) pyrogallol dissolved in methanol. Vortex cells for 10 sec.
5. Add 1.25 mL 60% (wt/vol) KOH. Vortex cells for 10 sec.
6. Incubate cells for 1 hr at 75°C. Vortex every 15 min for saponification.
7. Add 2 mL of hexane to extract the carotenoid fraction. Vortex for 1 min.
8. Centrifuge tubes for 5 min at 10,000g.
9. Mix hexane layer by pipetting up and down.
10. Pipette 1.2mL of hexane layer out into sealed test tube.
11. Pipette 1 mL of hexane into cuvette.
12. Measure absorption on spectrophotometer.
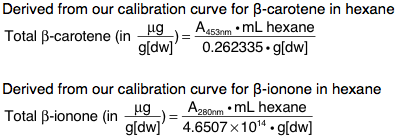
With our procedure and results we were able to derive formulas that correlated absorbance from the spectrophotometer to the total beta-carotene/beta-ionone concentration in yeast cells per gram dry weight of yeast cells.
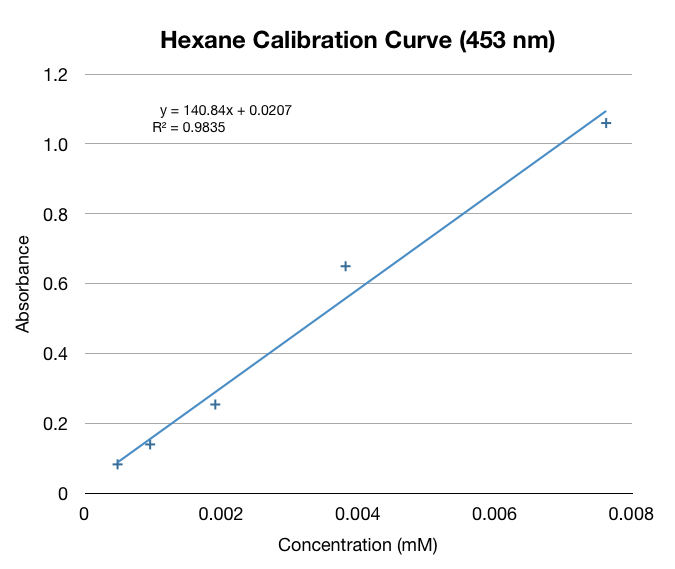
We made a calibration curve using serial dilutions of our beta-carotene in hexane stock solution (0.31mM).
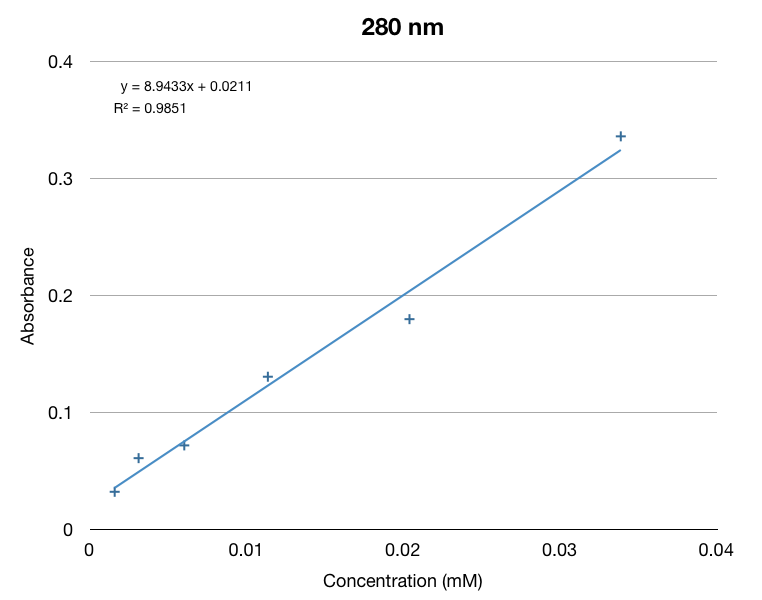
We made a calibration curve using dilutions of beta-ionone in hexane.
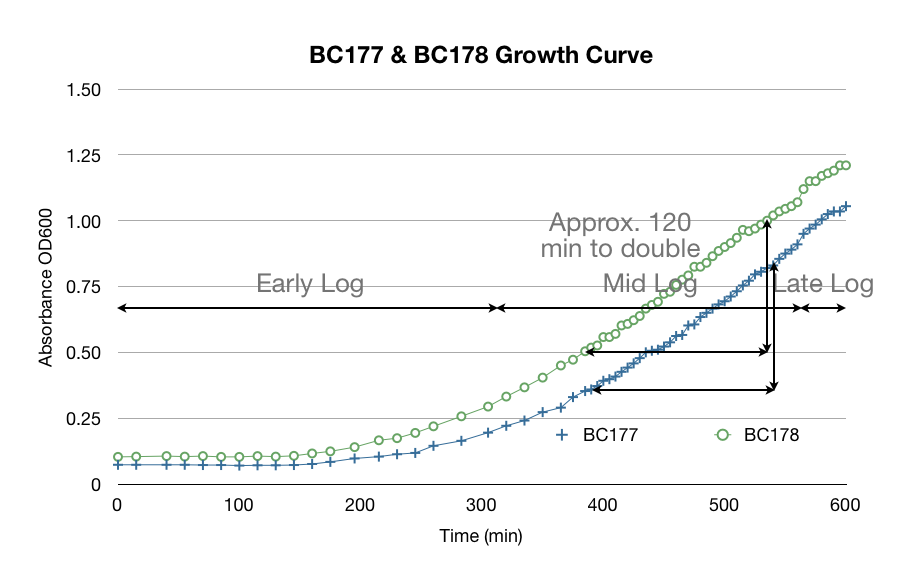
Before we started our hexane extraction procedures, we wanted to be sure we used yeast that were in mid-log phase to ensure that we had good data. The yeast growth curve below was made from taking a single colony from a petri dish and transferring it into a test tube filled with YPD. We logged its OD 600 to track its growth. We determined that it is in mid-log phase from 5 to 9 hours after transfer. We used this data to help plan our experiments and use proper mid-log yeast.
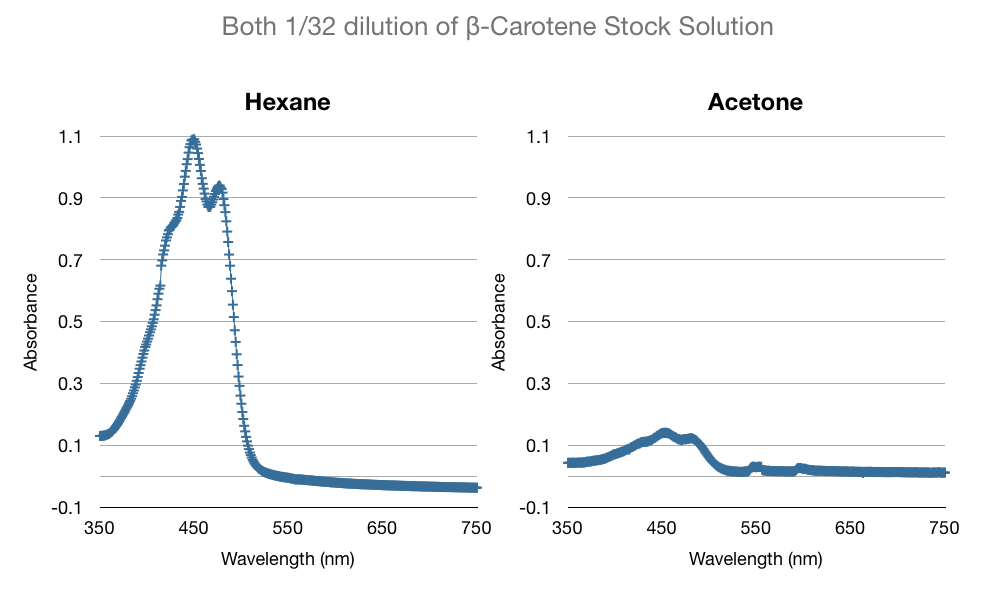
One of the many factors we tested to increase our extraction efficiency was to see if using hexane or acetone would affect our extraction. The data below is a comparison of the same amount of beta-carotene (1/32 dil. of stock) in hexane and acetone. As you can see below, the absorbance of beta-carotene stock in hexane vs in acetone are different. Acetone spectrum had some noise and considerably lower peak absorbance. We were concerned that the noise would affect our high-low limits of detection. We confirmed our suspicions through more experiments - hexane was able to detect up to 1/1024 dil. of stock vs. acetone's 1/256 dil. of stock. We consistently saw that acetone had noise, especially in the lower concentrations.
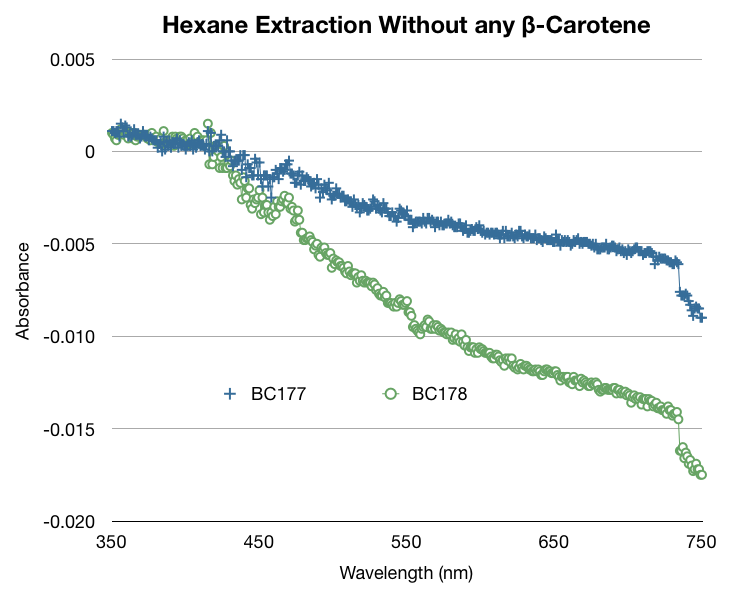
Another one of our concerns in the procedure was that perhaps when we extracted with hexane, some particles from the lysed yeast will be extracted with the beta-carotene and beta-ionone. We tested our suspicions by performing the extraction procedure without transformed yeast (i.e. regular wild type baker's yeast with no added carotenoid production genes). We observed that whatever yeast cell lysate that was extracted would not affect the extraction of beta-carotene. As you can see the absorption at 450nm is near zero. The absorption peak of beta-carotene is 450 nm.
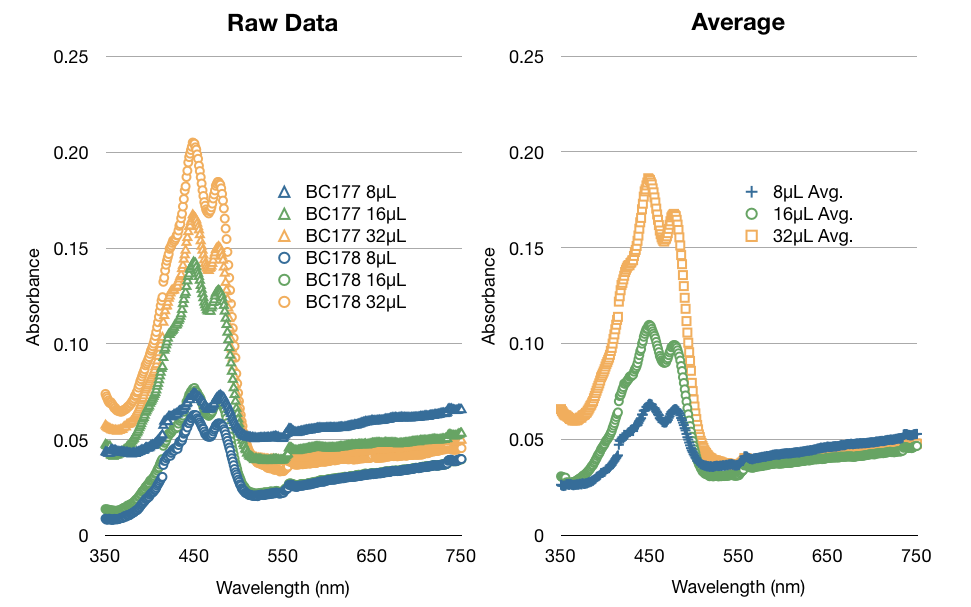
Once we were satisfied with our procedure we started performing extraction procedures with samples of yeast that contained specified amounts of beta-carotene stock solution. We found that taking only one sample of each concentration gave us unexpected absorbances. We learned that we should take 3 to 4 samples of each solution. As you can see, the averages of multiple samples yields a much better curve that makes more sense (as concentrations double, so should absorbances).
 "
"

